
After a brief review of what a dashboard is, this article will present some typical examples of organizational dashboards.
Overview: What are some dashboard examples?
A dashboard can be defined as a business reporting tool that consolidates and displays critical metrics and key performance indicators (KPIs). This allows you to monitor and evaluate organizational performance at a glance, usually in real time.
They can be used at any level of the organization although they are most frequently used at the executive and strategic level, as well as the tactical and operational level.
Here are some dashboard examples:
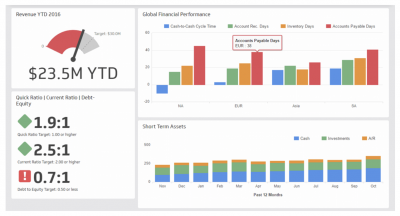
Executive dashboard for financial performance
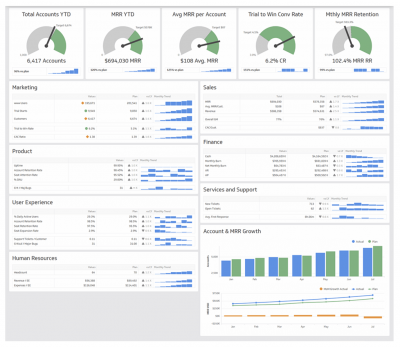
Executive dashboard for overall performance
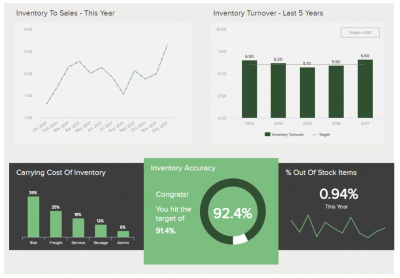
Dashboard for supply chain management
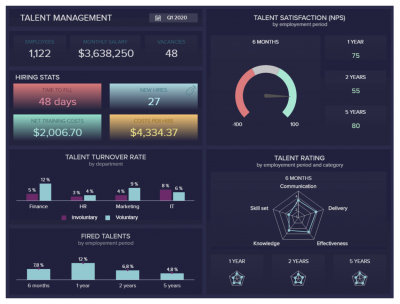
Dashboard for talent management
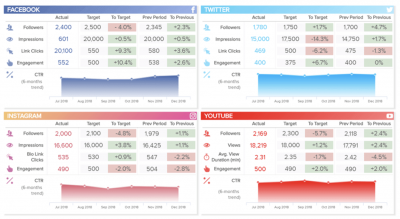
An industry dashboard example
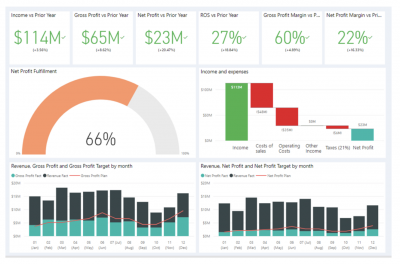
After learning about the power of using a dashboard to present key metrics to her executive leadership, Marilyn, the company Six Sigma Master Black Belt, downloaded one of the popular interactive data visualization software products to compile and present executive metrics to the executive team.
Below is the dashboard she created.
Frequently Asked Questions (FAQ) about dashboard examples
1. At what level of the organization can I use a dashboard?
You can use them at pretty much every level. You can have a high-level executive and operational dashboard as well as one for individual functions.
2. What’s the difference between a dashboard and a scorecard?
Dashboards are a way to track strategic goals and measure your company’s overall performance. Scorecards provide a way to measure your individual KPIs and give a clear indication of how well you are doing in achieving your organizational targets.
3. What are some examples of dashboard metrics for sales?
A few sales metrics which can be used in a dashboard are:
| Sales Metric | Definition |
| Revenue by Sales Person | The revenue each salesperson has generated, typically on a monthly basis |
| Win/Loss Rate | The percentage of deals won vs. the percentage of deals lost |
| Loss Rate by Phase | The percentage of deals lost during phases of the sales cycle |
| Average Sales Cycle Length | How long it takes to close a sale |
| Sales Activity | The number of sales activities like appointments or calls completed by sales rep |
| Response Time | The time it takes to respond to or close a task |
| Customer Lifetime Value | The total value of a customer during the life of your relationship |