
A population can be defined as the infinite set of things that is of interest for the purpose of making a decision. The statistical descriptors (parameters) of a population will include measures of central tendency, variation, and shape. Unfortunately, we can’t measure everything in a population. We must use samples taken from the population to infer something about the population parameters.
In this article we will discuss the use of confidence intervals (CI) as a method of using sample statistics to make inferences about population parameters. We will explore what a CI is, its benefits, and some best practices for using them to estimate population parameters from sample statistics.
Overview: What is a CI?
We know when you take the average of a sample, it’s probably not exactly the same as the average of the population. Sample statistics, such as mean and standard deviation, are only estimates of the population parameters. Any sample statistic will vary from one sample to another, and from the true population or process parameter value. Because there is variability in these estimates from sample to sample, you can quantify your uncertainty using statistically-based confidence intervals. Confidence intervals provide a range of plausible values for the population parameters (mu and sigma).
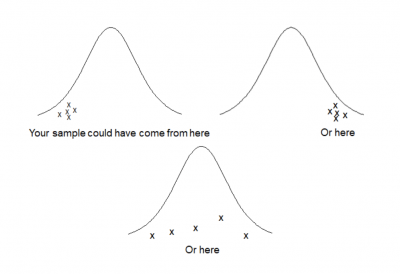
This can be illustrated by understanding that when you take a random sample from a population, you don’t really know from where in the population your sample was drawn. This results in the variation of the sample statistics and the error in your inference of the population parameters.
The standard format for a CI is the sample statistic plus and minus some margin of error you make when trying to use the sample to infer something about the population parameter.
Estimate (sample statistic) ± Margin of Error
The factors that influence your margin of error are: the sample variability (standard deviation), the level of confidence you want to have when making your inference (typically 90%, 95% or 99%), and the size of your sample (n).
You can see these three factors in the formula below.
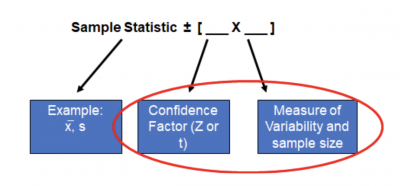
The smaller the sample size, the wider the CI since you have less information about the population, so you need a wider range of possible values to account for the random error. The same would hold true for a large amount of variability in the sample.
Finally, the more confidence you want, the wider the CI to reflect your desired certainty the CI will contain the true population parameter.
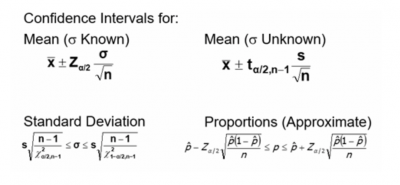
For example, the form of a 95% CI for estimating a population mean is shown below.

There is much misunderstanding of exactly what CI really means. A 95% confidence level does not mean that for a single sample CI interval there is a 95% probability the population parameter lies within the interval. The true definition is, if you took 100 samples and calculated a CI for each one, over time, you would expect 95 of those CIs to contain the true population parameter. Five of them will not.
CIs can be calculate for many statistical parameters. Here are a few:
3 benefits of a CI
It’s incorrect to use one sample statistic to estimate any population parameter. Because of the random error in choosing your sample, the single point estimate will likely be a poor estimate of the parameter.
1. Provides a plausible range
The CI provides a plausible range of possible values for your population parameter that is statistically based and calculated.
2. Adjusts for varying values of sample size, variability, and desired confidence
You are able to review multiple scenarios by varying your sample size and desired confidence level to balance the cost of sampling and quality of inferences about your population parameters.
3. Concept has wide applications
The concept of CI can be applied to many different statistical applications ranging from basic inferential statistics to regression and process capability.
Why is CI important to understand?
It is important to understand how to interpret a CI and how it impacts your statistical decision-making.
It is not practical to measure the parameter of a population
Properly calculated CIs will allow you to make decisions regarding your population using samples and simple calculations.
Determine the width of the CI
The width of your CI will be influenced by three factors: sample size, variability of the sample, and level of desired confidence. The combination of those factors will determine the width of the confidence interval. Small sample sizes, high variability in the sample, and a higher confidence level will widen the CI. The opposite will result in a narrowing of the CI.
Remain flexible
Use CIs rather than individual point estimates when inferring something about your population. This can be applied to many statistical tools
An industry example of using a CI
A large banking institution received a growing number of negative comments on their customer survey about long wait times for phone calls to be answered. While the technology allowed them to capture the actual wait time for every call, they decided to sample some calls at random times during a one week time frame. They also surveyed some customers to find out how long they were willing to wait for a call to be answered before hanging up. The average response was 60 seconds.
Based on the sample data, they calculated that the average wait time was 55 seconds. Management was confused why there were so many complaints when the survey data showed the bank, on average, was answering calls faster than the customer expectation. The bank’s Lean Six Sigma Black Belt BB) suggested they calculate a confidence interval for the sample and not rely on the sample average to make inferences about the total population of calls.
Using the sample average time, standard deviation — and assuming a 95% confidence level — they calculated the 95% confidence interval. The values were (53.232 – 57.220 seconds). They interpreted this to mean the actual population average call time should be less than 60 seconds, so customers shouldn’t be complaining.
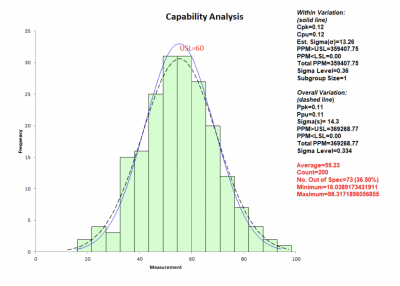
The BB pointed out customers don’t care about the average time they wait, but that each call be less than 60 seconds. She suggested they do a process capability analysis and see what percent of the calls are beyond 60 seconds of wait time.
The graph below shows, while the average is less than 60 seconds, more than one-third of the calls exceed 60 seconds. They finally realized they had a problem and formed an improvement team to address it with a Kaizen event.
3 best practices when thinking about a CI
Follow these tips to better understand how to create and interpret a confidence interval.
1. Use the t rather than Z distribution for your confidence level
The Z distribution is an assumption of large samples. The t distribution was designed for small samples. Since both are based upon the normal distribution, it is safer to use the t since the t value you will use in your calculations approaches the Z value as sample sizes approach 1,000. You don’t have to worry about the sample size if you use the t distribution.
2. Determine the appropriate sample size ahead of time
Since sample size has a significant impact on the width of the CI, compute your sample size before starting your data collection.
3. Select the appropriate confidence level
Depending on the importance of what you are making a decision about, consider your desired confidence level. Is 90% sufficient? How about 95%? Or 99%?
Frequently Asked Questions (FAQ) about CI
What does a 95% confidence interval really mean?
If you take 100 random samples from your population and calculate a confidence interval for each one, you would expect, over time, that 95 of those sample confidence intervals will contain the true population parameter.
Why is a 90% confidence interval narrower than a 95% confidence interval?
A 90% confidence interval will be narrower because, as the precision of the confidence interval increases (CI width decreases), the probability of an interval containing the actual parameter will decrease.
At a 95% confidence level, only 5 out of 100 sample confidence intervals will fail to contain the true population parameter. At a 90% confidence level, 10 of those 100 sample confidence intervals will not contain the true population parameter.
In other words, you will increase your error rate as your confidence level goes down.
What are the three factors that impact the width of a confidence interval?
Sample size, variability of the sample, and level of desired confidence.
CI wrap-up
You cannot measure everything in a process, so you must take samples and then make inferences about your population. The problem is, the point value of your sample statistic will not provide adequate information to draw conclusions about your population parameter.
The confidence interval solves this problem by providing a plausible range of values for your population parameter based on taking your sample point estimate and adding and subtracting a margin of error. The calculated margin of error will be a function of the sample size, sample variability, and desired level of confidence that your confidence interval will encompass the true population parameter.