We know there are a number of statistical tests for establishing the relationship between continuous data variables. But what if you have categorical variables? The Chi-Square Test allows you to explore the relationship or association between categorical variables. This article will explain what the Chi-Square Test is, how it works, and how you can apply it in your organization.
Overview: What is the Chi-Square Test?
When you want to see whether there is an association between two categorical variables, you can use a Chi-Square test for association. This tests if the probabilities of items being classified for one variable depends on the classification of the other variable.
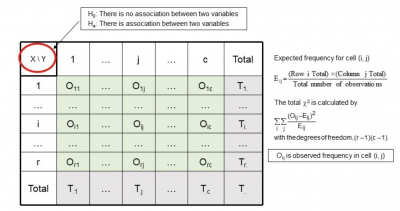
The Chi-Square Test is a form of a hypothesis test. As in all hypothesis testing, there is a null hypothesis and an alternate or alternative hypothesis. It is written this way:
- Ho: There is no association between two variables
- Ha: There is association between two variables
The data is captured and formatted into a table. The general design is as follows:

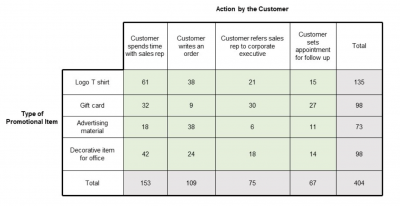
As an example, let’s see what it would look like if you wanted to test whether there was any association between types of promotional materials and action by the customer.

Notice that we have two categorical variables: promotional item and customer action. The values in the table cells are the number of times a specific customer action occurred for a specific type of promotional item.
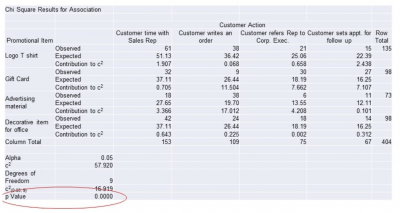
You would usually run this type of analysis with statistical software. The output would be presented in a tabular format showing:
- Observed values
- Calculated expected values
- Calculated contribution to the overall Chi-Square value
- Calculated p-value used to determine whether to reject or not reject the Ho
Here is the output for our example:

Note that the p=value is zero. Since the null hypothesis stated that there was no association, the p-value tells us to reject the null hypothesis and conclude that the alternate hypothesis is true. There is an association between promotional items and customer action.
3 benefits of the Chi-Square Test
You want to replace your intuition with solid statistical analysis. The Chi-Square test gives you the following benefits over using your intuition.
1. Lets you explore the relationships between categorical variables
You are familiar and probably comfortable looking at relationships between continuous variables. The Chi-Square Test gives you a solid option for looking at relationships and associations between categorical or discrete variables.
2. Using statistical software makes the calculations and conclusions easy to understand
By using statistical software to explore the relationship between categorical variables, you will get an output that allows you to get insight and take action if there is a relationship and association.
3. Allows a versatile use of data
Since the data is formatted in a table, you can explore any number of categorical variables and are not restricted to just using a 2×2 table.
Why is the Chi-Square Test important to understand?
The output of the Chi-Square Test can help you better understand what your data is telling you.
Primary method for establishing relationship and association between categorical variables
If you are using categorical variables, you don’t really have a choice of using another statistical tool. While you might not need to understand all the underlying statistical calculations, you should understand when it is appropriate to use the Chi-Square Test.
Useful tool for dealing with survey data
Many survey results are in a categorical or attribute format (Gender, Income Range, Age Range, Ethnicity, Location, etc.). The Chi-Square test allows you to analyze this information and do the necessary cross tabulations to determine whether there is a statistical difference between the segments/categories in how the respondent answered the question.
Points out the variables that have the strongest association
One of the outputs of the Chi-Square Test is the percent contribution to the Total Chi-Square value. The variable with the highest contribution can be considered to have the strongest association although it should be interpreted as a relative association rather than an absolute value.
An industry example of using the Chi-Square Test
A large consumer products company was interested in whether there was a relationship or association between their portfolio of products and when they are used by the customer. They were planning to use this insight to guide their advertising and promotion budgets and content. A national consulting firm completed extensive surveys, and the company captured data about when and under what circumstances or occasions customers used their various products.
Although the organization ultimately used more sophisticated statistical tools, the Chi-Square Test was an easy and quick first step to understand the data and relationships. The outcome and insights were very interesting. Here are a few examples of what they found out:
- One product which they thought was applicable for any time of day, was associated and used by the customer primarily as a breakfast item.
- Rather than being associated with group occasions, one product turned out to be viewed as a personal reward after a hard day at work.
- A popular product was used more often as a mixer rather than being consumed on its own.
These and many other insights allowed the marketing department to shift its advertising focus and content to be consistent with how and when their key products were being consumed. The result was a nice increase in product sales.
3 best practices when thinking about the Chi-Square Test
As in all statistical testing, there are some assumptions and watch-outs when doing a Chi-Square Test.
1. Agreement with the operational definitions of the categorical variables
Since the variables used in a Chi-Square Test are categorical in nature, it is important that there is a common and agreed upon operational definition of these variables. For example, if one of the variables is “Customer Satisfaction” be sure that everyone agrees with the definition of the phrase so when you collect the data, there is consistency.
2. Test assumptions
Because of the underlying statistical assumptions of the Chi-Square Test, verify that all the assumptions are satisfied. For example, the number of observations in a cell must be five or greater in number to satisfy the underlying assumptions of the distribution.
3. Keep your variables independent
Your categories need to be independent and the data randomly selected for the Chi-Square test to be valid.
Frequently Asked Questions (FAQ) about the Chi-Square Test
What type of data do I use for a Chi-Square Test?
The data variable must be categorical. For example; Male/Female, North/South/East/West, Red/Green/Blue, Crispy/Soggy, etc.
Am I restricted to only using a 2×2 table for the Chi-Square Test?
No. You can use any number of levels within your category type.
What happens if I have small sample sizes?
Unfortunately, the Chi-Square Test is sensitive to small sample sizes. You must have at least 5 observations in any cell. Variables must also be independent. In the event that you do have small sample sizes, you will need to use the Fisher’s Exact Test to explore the association between your categorical variables.
Let’s summarize the Chi-Square Test
The Chi-Square Test is a handy tool for establishing the relationship or association between categorical variables. If you have a larger enough sample size and your variables are independent then statistical software can be used to do the calculations.
You can use the p-value to determine whether there is a statistically significant association or not. In addition to determining an overall association, you can also gain insight into what characteristics of your categories might be the biggest contributors to your association.