Key Points
- Bimodal distributions have two modes.
- They can indicate you’re using two different sets of data.
- You’ll want to separate the data sets for in-depth analysis.
Overview: What Is a Bimodal Distribution?
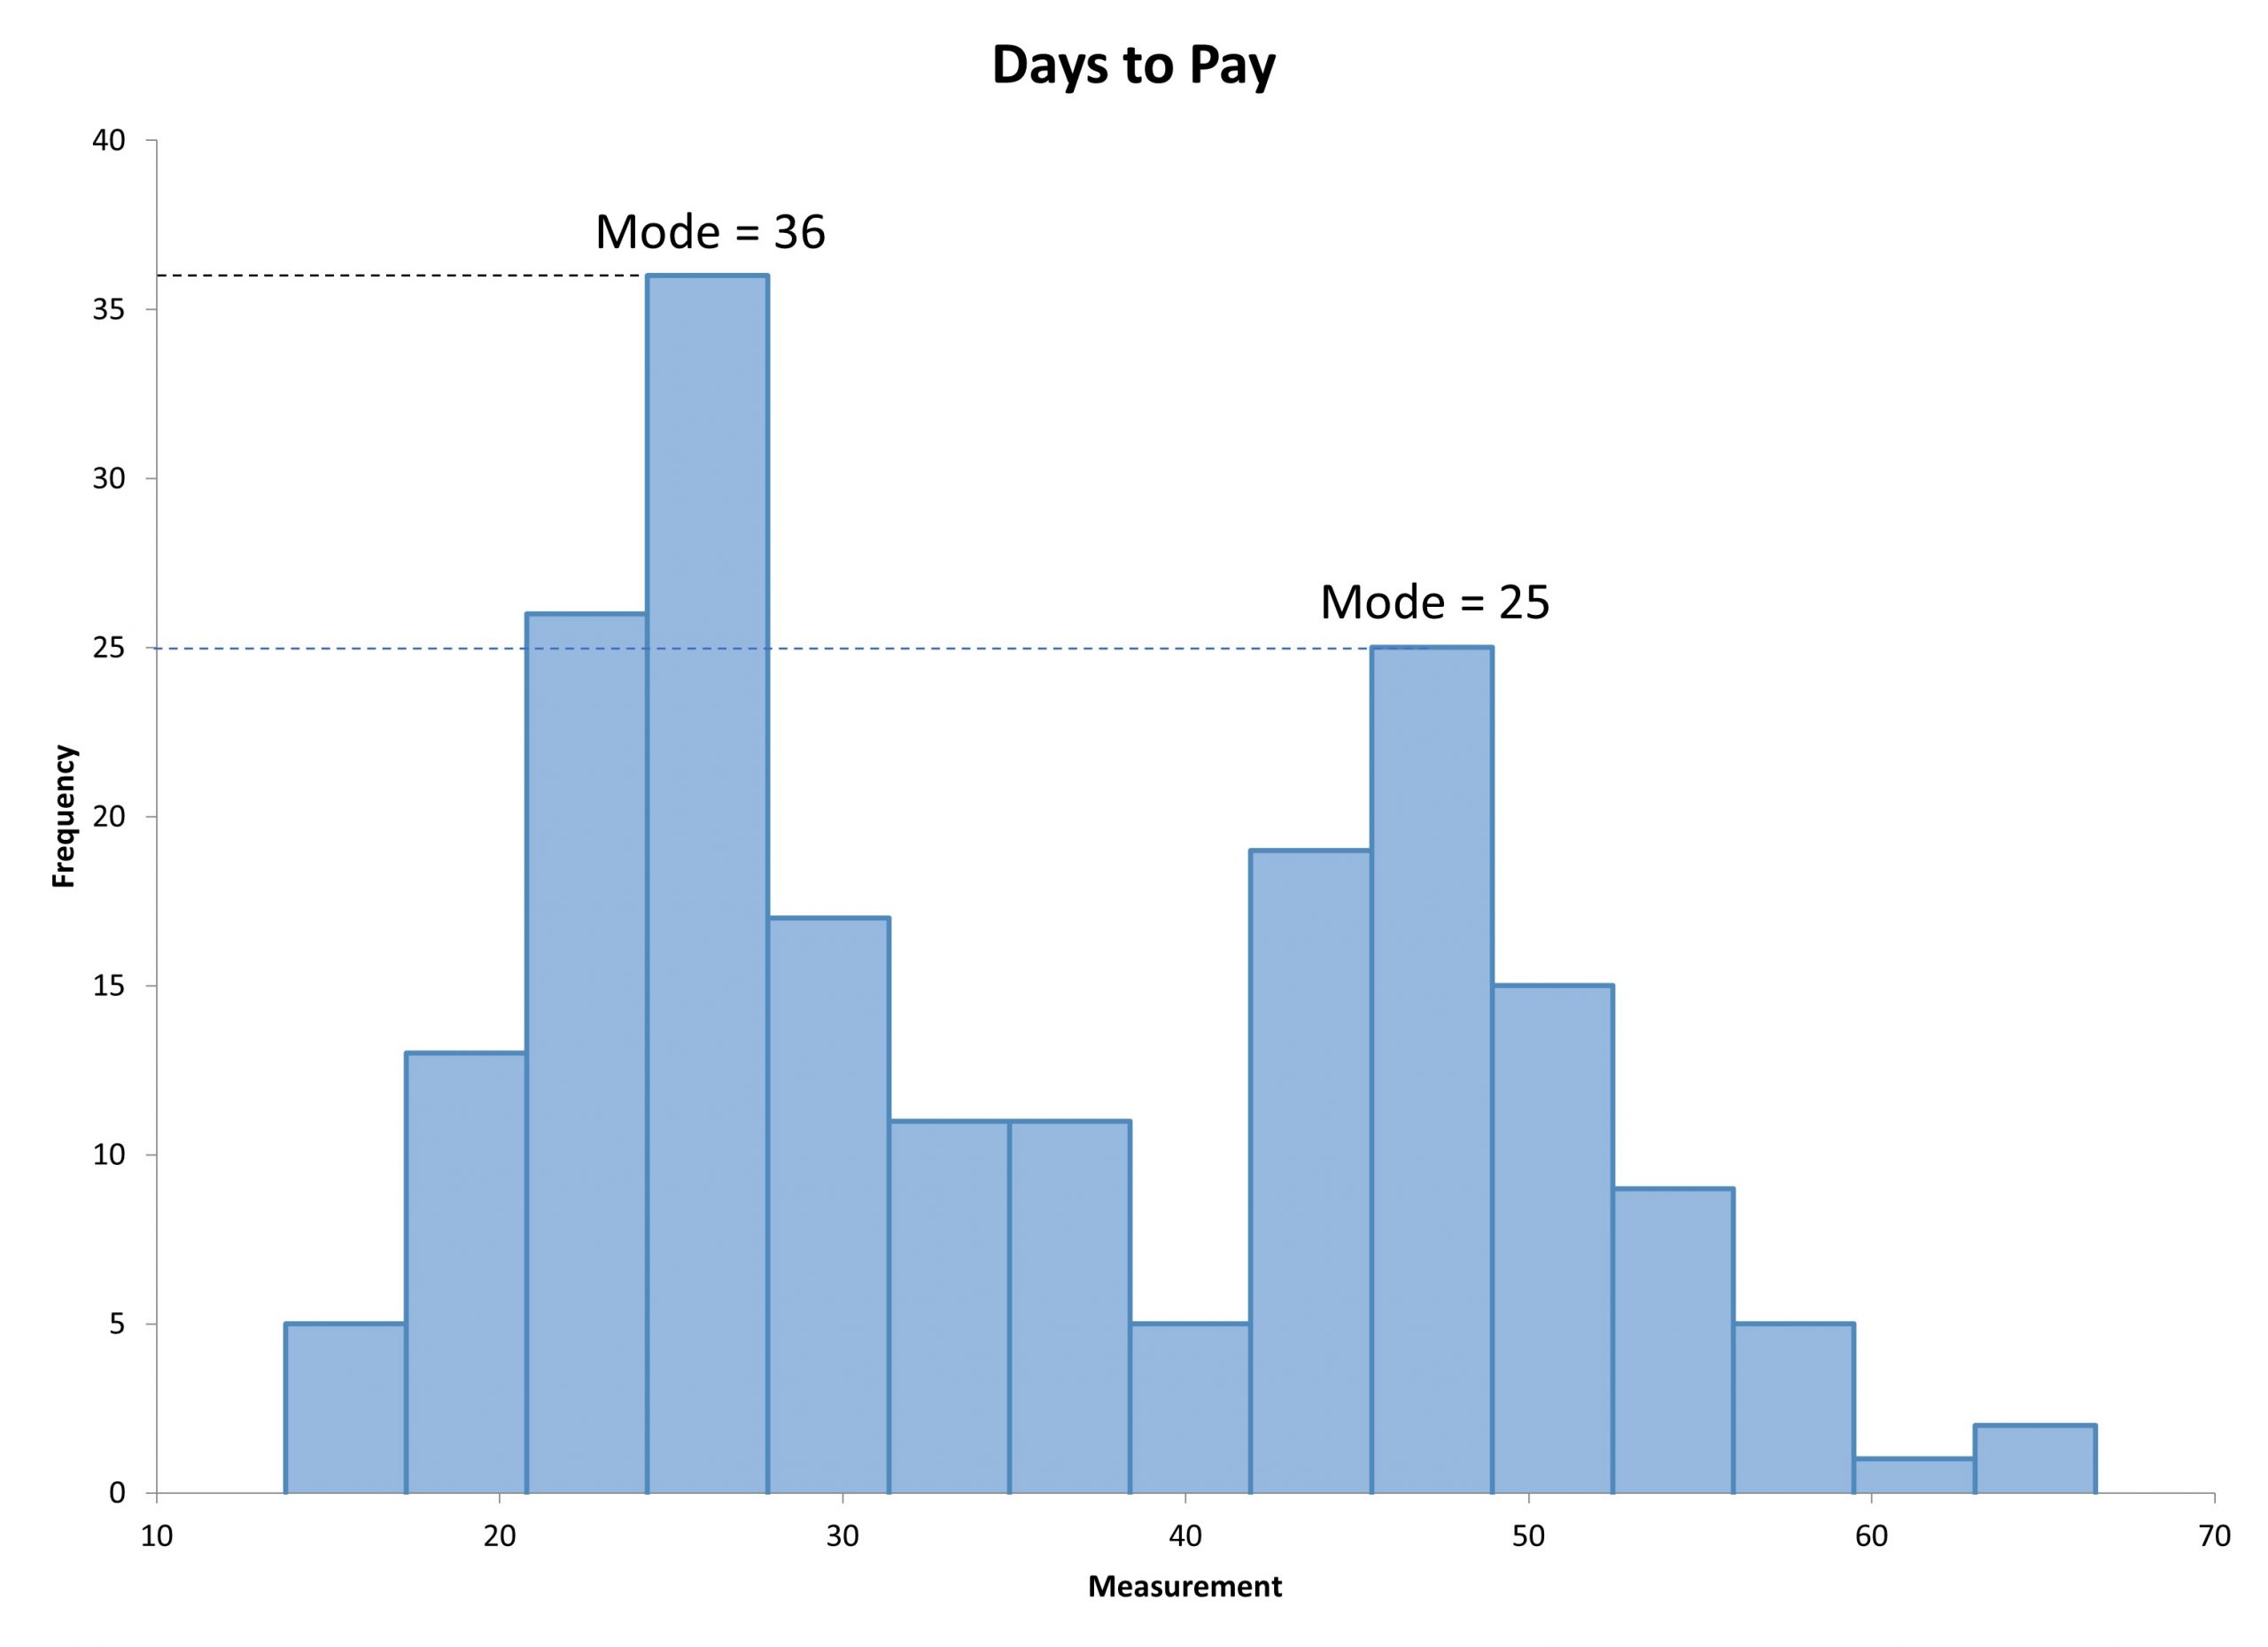
A bimodal distribution will have two modes. These are two values that will occur the most frequently in your data set. This can easily be seen if you present your data in the form of a histogram. The graph of your data will exhibit two humps.
A bimodal distribution indicates you may have combined two distinct groups of data. This may impact the conclusions and interpretation if your two groups should be analyzed separately. The solution is easy. You will want to separate the two groups and interpret them separately, rather than combined.
Why It Matters
Not all of your data is going to be perfect. As such, being able to readily recognize when there are issues like two separate modes is crucial. This enables you to break down the data sets into their constituent parts and analyze them as needed.
Further, identifying two modes is going to allow your statistical analysis to hone in on the reasons for these discrepancies in data. They might not be common to encounter in your regular analysis, but it is important to understand just what you’ll encounter.
An Industry Example of a Bimodal Distribution
The Finance Manager was trying to understand his accounts receivable data. The histogram below illustrates the number of days his customers take to pay their bills. It is easy to see that some customers are fast payers and some are slow.

A team was put together to try and understand why customers pay differently. The goal was to get all customers to pay their bills faster.
Other Useful Tools and Concepts
Looking for some other tips and tricks? You might do well to learn how to identify stakeholders using ARMI in your projects. This a fast and surefire method to identifying some of the most important individuals in your projects.
Additionally, you might want to look into the efficacy of using flowcharts in your Lean Six Sigma projects. These tools are great for keeping everyone on the same page while using a standardized language of easily understood symbols.