
 A medical devices company, developing technology to enable smaller medical devices, launched a substrate development effort as part of a larger-scale technology and product development effort. The substrate development effort involved predicting the stress caused by the laser welding process to ensure product reliability.
In this Design for Six Sigma (DFSS) case study, design and analysis of computer experiments (DACE) was applied to risks associated with laser welding in an electronic welding process on a substrate. This process, DACE, was selected so that computer simulations could be used to predict the stresses and warp of the specimen with varying factor levels. Rather than creating eight different samples, all work was able to be simulated with a computer, saving time and money.
The DFSS Project
DFSS involves first identifying critical parameters (Ys) strongly associated with success for the project, flowing those critical parameters down to the controllable factors (Xs) and uncontrolled “noise” (n’s) that could affect the critical parameters. Next, predictive engineering and optimization are applied to ensure that expectations will be met for the critical parameters over the range of use conditions or noise factors. The process concludes by verifying that expectations were successfully met.
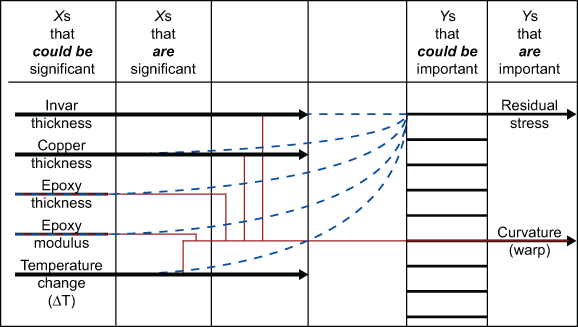
While critical parameters are often translated from customer expectations, critical parameters for the laser welding process in this example were derived from risks associated with this process: residual stress and curvature or warp after a series of heat treatments. As described above, the first step was to identify the critical parameters. The team followed a method of identification shown in Figure 1.
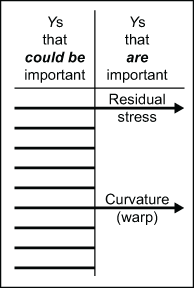
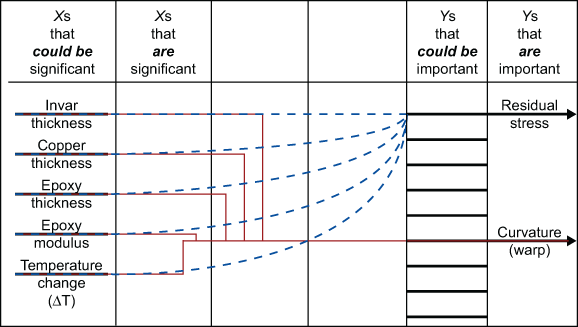
The critical parameters of stress and curvature were flowed down to five process parameters that could affect stress and curvature and be controlled in a lab environment, including the thickness of three layers involved in the substrate:
- Invar thickness
- Copper thickness
- Epoxy thickness
- Epoxy modulus of elasticity
- Temperature change (ΔT)
Figure 2 illustrates the flow down from critical parameters to the five control factors. The red (warp) and blue (residual stress) lines show that all five factors flow down into both of the critical parameters. For example, the invar thickness has an effect on both the residual stress as well as the curvature.
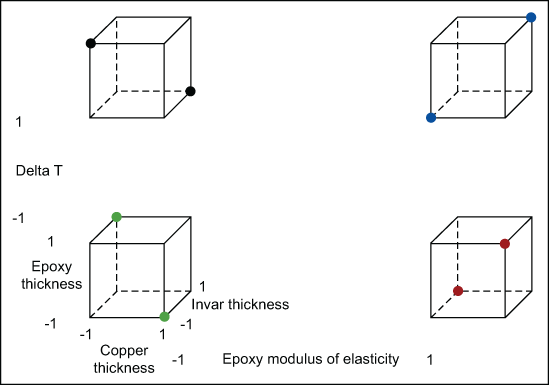
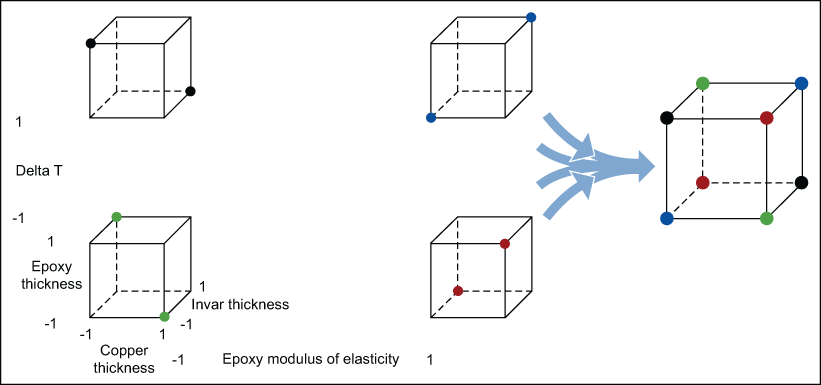
Predictive engineering was used with a strategy of sequential experimentation. A 25-2 fractional factorial (experimental designs using a fraction of the runs of a full-factorial design) design of experiments (DOE) was used to determine whether some of these five process parameters (as factors in the DOE) have a negligible impact on the critical parameters of stress and curvature, as illustrated in Figure 3. The colors on the different boxes in Figure 3 show that after two factors are eliminated, those data points become points on the full factorial box. Each dot represents a run with the different levels of the factors to include on it. Initially a 25-2 was run, so this shows the eight different runs to be completed.
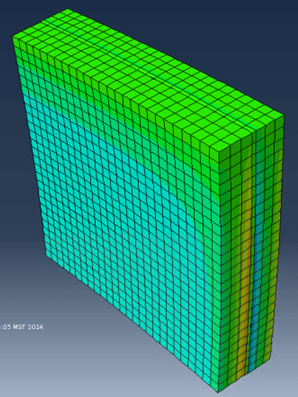
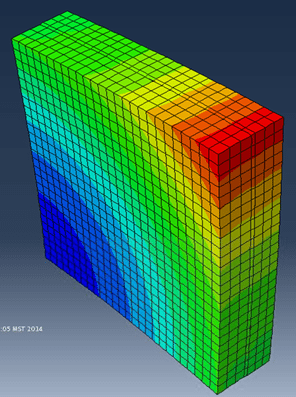
In conjunction with the DOE, finite element analysis software was used to predict two responses from each run – the stress and the deformation. The images below represent the stress (Figure 4) and deformation (Figure 5) as the sample undergoes a temperature change. The high stress and deformation areas are designated by the red color. The low stress and deformation areas are designated by the dark blue color. The deformation of a single layer was imported into MATLAB (a matrix computing environment) to calculate the resulting radius of curvature, representing warp.
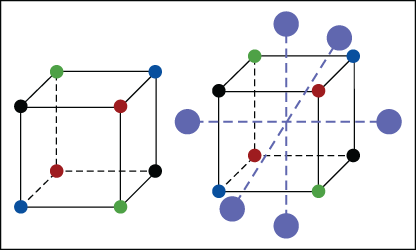
From the results of the DOE, two of the five factors – both associated with epoxy (strong adhesive) – were found to have negligible impacts on both responses (via a pareto analysis); this allowed the DOE to be effectively reduced to the three remaining factors, as shown in Figures 6 and 7. Figure 6 shows that after two factors are eliminated, the data points from those high and low levels have no significant difference, so the data essentially becomes the data of a 23 full factorial.
The next step in this sequential experimentation was augmenting the reduced factorial experiment with a center-point and star-points into a central composite design (CCD), as displayed in Figure 5. A CCD more fully explores the extremes of the factor levels. It goes beyond the +1/-1 levels to get a better understanding of the effects the factors may have on the results.
The CCD was comprised of a center point and six star points. The star points represent the +/-2 alpha levels of the factors. The purple dots in Figure 8 are the star points, so named because when the dots are connected to one another through the center, the resulting shape is a star. There are six because there are two extreme cases for each important factor. This analysis helps provide a more accurate understanding of the effects on the outputs.
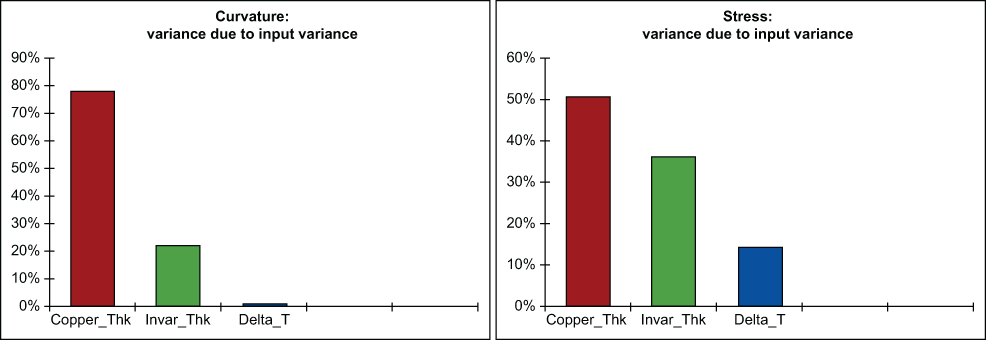
This CCD was analyzed and provided a transfer function that was used for predictive engineering. This function could be used to predict the stress under specified levels of the three important factors. The variance contribution of each of the remaining three factors for the variance of the two responses of stress and curvature were calculated using the generation of system moments method (as opposed to Monte Carlo simulation), and are illustrated in Figure 9. (This rather approach requires some calculus at the start, but it not only quickly provided the variance contributions in Figure 9, but it also enabled the authors to develop the Cpk and yield surfaces in Figures 10, 11 and 12.)
Transfer functions for curvature and stress were used in conjunction with the generation of system moments method to develop response surfaces (a visual representation of the approximate output based on the input levels of the factors) and Cpk surfaces, in a methodology referred to as yield surface modeling as shown in Figures 10 and 11. These figures represent the output based on the factor inputs as well as the capability based on the inputs. Capability is essentially a measure of safety within the tolerances specified.
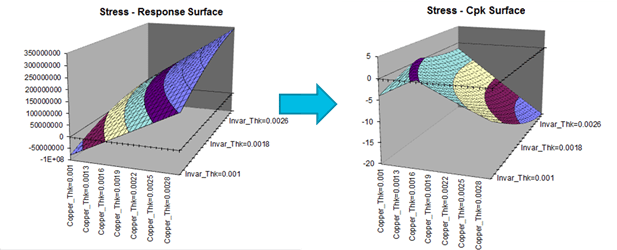
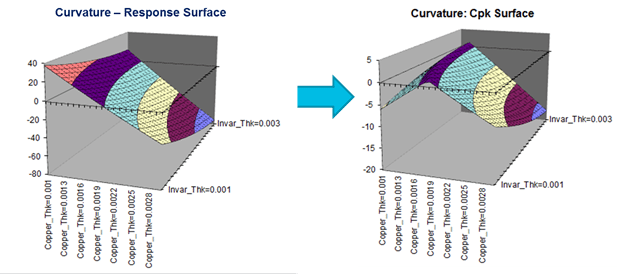
Yield surface modeling is a way to optimize a design around multiple responses. The Cpk surfaces reflect the confidence and safety associated with combinations of different values of the factors. The two Cpk surfaces were combined and translated into a composite yield surface, as shown in Figure 12, which shows at what levels of factors the design will be the best. Because the Cpk surfaces take into account the tolerances, this is useful for seeing the predicted yield with different factor level inputs.
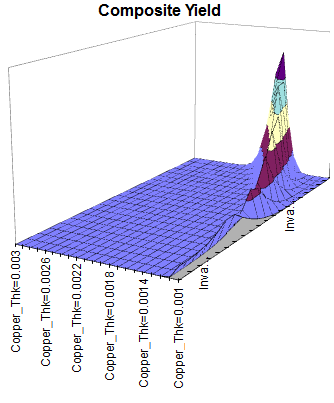
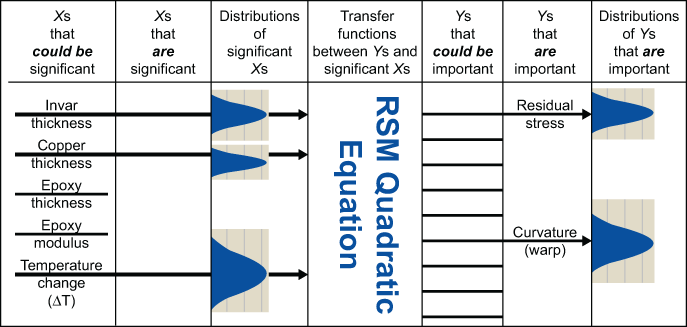
The optimal settings for the factors to optimize the Cpks, as illustrated in the yield surface of Figure 12, was obtained using Crystal Ball with OptQuest, as shown in Figure 13. Figure 14 summarizes the project from identification of critical parameters to finding settings for their co-optimization.

Figure 14 summarizes the entire project from identifying critical parameters (important Ys), flowing them down to factors, screening the significant factors, comprehending the distributions of the significant factors and their impact on the distributions of the critical parameters through transfer functions derived from the RSM quadratic equations. Those equations will be used to compare to a measurement technique. If the measurement technique matches the predicted value from the equation, the measurement technique will be validated. Finally, the project ends with finding values or settings for the significant factors to optimize both the critical parameters of residual stress and curvature or warp.
The results of this study and optimization and the stress measurement technique were validated with laboratory results.
Summary
A DFSS project successfully identified significant factors affecting two critical parameters reflecting risks for a new technology and associated medical products, and provided optimal settings related to the laser welding process to produce optimal reliability. In addition, it was determined that the stress can be predicted using the transfer function based on the settings of the laser welding process.
This entire project was completed quickly and efficiently – during a summer internship.