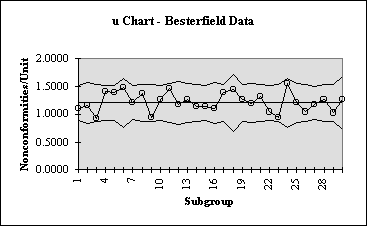
Attribute control charts arise when items are compared with some standard and then are classified as to whether they meet the standard or not. The control chart is used to determine if the rate of nonconforming product is stable and detect when a deviation from stability has occurred. The argument can be made that a LCL should not exist, since rates of nonconforming product outside the LCL is in fact a good thing; we WANT low rates of nonconforming product. However, if we treat these LCL violations as simply another search for an assignable cause, we may learn for the drop in nonconformities rate and be able to permanently improve the process.
The u Chart is used when it is not possible to have an inspection unit of a fixed size (e.g., 12 defects counted in one square foot), rather the number of nonconformities is per inspection unit where the inspection unit may not be exactly one square foot…it may be an intact panel or other object, different in size than exactly one square foot. When it is converted into a ratio per square foot, or some other measure, it may be controlled with a u chart. Notice that the number no longer has to be integer as with the c chart.
Steps in Constructing a u Chart
- Find the number of nonconformities, c(i) and the number of inspection units, n(i), in each sample i.
- Compute u(i)=c(i)/n(i)
- Determine the centerline of the u chart:
- The u chart has individual control limits for each subgroup i.
- Plot the centerline, ubar, the individual LCL’s and UCL’s, and the process measurements, u(i).
- Interpret the control chart.


Example:
Besterfield Example:
data is from Besterfield (1990): Quality Control  p. 185

                        Number          Nonconformities
Day     Number          Non-            Per
        Inspected       Conformities    Unit
1       110             120             1.0909
2       82              94              1.1463
3       96              89              0.9271
4       115             162             1.4087
5       108             150             1.3889
6       56              82              1.4643
7       120             143             1.1917
8       98              134             1.3673
9       102             97              0.9510
10      115             145             1.2609
11      88              128             1.4545
12      71              83              1.1690
13      95              120             1.2632
14      103             116             1.1262
15      113             127             1.1239
16      85              92              1.0824
17      101             140             1.3861
18      42              60              1.4286
19      97              121             1.2474
20      92              108             1.1739
21      100             131             1.3100
22      115             119             1.0348
23      99              93              0.9394
24      57              88              1.5439
25      89              107             1.2022
26      101             105             1.0396
27      122             143             1.1721
28      105             132             1.2571
29      98              100             1.0204
30      48              60              1.2500

Calculations:

UBAR =  1.2005

UCL =   ubar + 3*sqrt(ubar/n(i))
LCL =   ubar - 3*sqrt(ubar/n(i))

Day     CL      UCL             LCL             Nonconformities/Unit
1       1.2005  1.513900448     0.887091405     1.09
2       1.2005  1.563485937     0.837505915     1.15
3       1.2005  1.535975424     0.865016429     0.93
4       1.2005  1.507011595     0.893980258     1.41
5       1.2005  1.51678903      0.884202823     1.39
6       1.2005  1.639741695     0.761250158     1.46
7       1.2005  1.500557911     0.900433942     1.19
8       1.2005  1.532534517     0.868457335     1.37
9       1.2005  1.525958845     0.875033008     0.95
10      1.2005  1.507011595     0.893980258     1.26
11      1.2005  1.550892833     0.850099019     1.45
12      1.2005  1.59059276      0.810399092     1.17
13      1.2005  1.537736483     0.86325537      1.26
14      1.2005  1.524375074     0.876616779     1.13
15      1.2005  1.509712226     0.891279627     1.12
16      1.2005  1.55702269      0.843969162     1.08
17      1.2005  1.527566079     0.873425774     1.39
18      1.2005  1.707693252     0.693298601     1.43
19      1.2005  1.534241668     0.866750185     1.25
20      1.2005  1.543190862     0.857800991     1.17
21      1.2005  1.529197361     0.871794491     1.31
22      1.2005  1.507011595     0.893980258     1.03
23      1.2005  1.530853298     0.870138554     0.94
24      1.2005  1.635871613     0.76512024      1.54
25      1.2005  1.548918751     0.852073102     1.20
26      1.2005  1.527566079     0.873425774     1.04
27      1.2005  1.498088223     0.90290363      1.17
28      1.2005  1.521275681     0.879716172     1.26
29      1.2005  1.532534517     0.868457335     1.02
30      1.2005  1.674935581     0.726056271     1.25
u – Chart:
