When the principles of statistical process control (SPC) are used to manage a business or manufacturing process, any indication of the process going out of control will prompt some action on the part of the process owner. When it is well used, SPC will detect shifts in the process due to issues such as tool wear, relaxed performance standards, sudden changes in supplier quality. When corrective action is taken quickly, the process should exhibit only common cause variation. This ideal situation is usually only observed in production environments with well-designed automatic control systems.
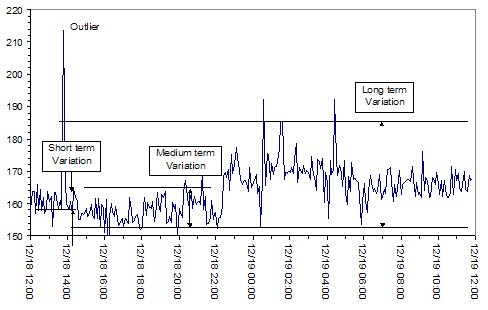
Figure 1 shows some typical data derived from a production line where:
- Single data points were gathered every five minutes
- The cost of producing a defect was quite low
- Intervention to correct a drift in the process would interfere with production

The process depicted in Figure 1 is out of control, according to SPC rules. The upward shift in the process from late Dec. 18 to early Dec. 19 is clear. Employees avoided making corrections until the process drifted beyond the specification limits resulting in minimal short-term variation. Long-term variation, however, was much larger.
Quantifying the Z Shift
A convenient metric for summarizing the probability of a defect is the process capability as expressed by the Z value. (All Z values refer to continuous data unless indicated otherwise.) The true, long-term defect level, known as long-term Z, is calculated using the upper specification limit (USL), lower specification limit (LSL) and the long-term variation as illustrated in Figure 1 and summarized in Equation 1 below:

The calculation of short-term Z using Equation 1 is mathematically similar to that for long-term Z. The reduction goal is expressed as the Z shift and illustrated in Equation 2 below:
![]()
Author Mikel J. Harry published in The Vision of Six Sigma: A Roadmap for Breakthrough, 1994, a summary of data from Asea Brown Boveri showing a relationship between Z values for a number of manufacturing processes concluding that:
- There is no typical Z shift value
- The short-term Z value is larger than the long-term Z value
- The data covers a large range of process capabilities
- There is a general increase in Z shift with an increase in short-term Z
- The relationship between Z shift and short-term Z is non-linear
The calculation of long-term Z assumes the process data is normally distributed. When a process contains only common cause variation, this assumption is not violated too severely. At extreme values of Z shift long-term Z values, calculated using Equation 1, will over-estimate the defect probability.
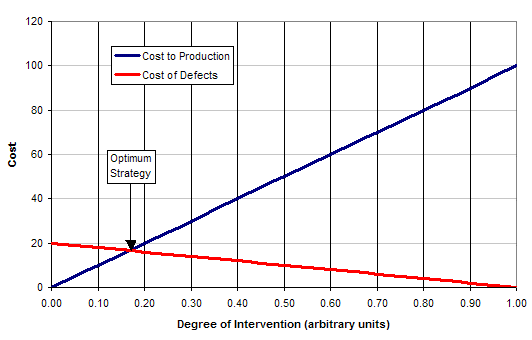
In many organizations, the goals of increasing production and reducing defects conflict. As a result, process owners may decide to constantly adjust the process to decrease defect levels, resulting in decreased production levels. The optimum balance between these two extremes using the functions of defect scrap/rework cost versus production downtime cost is shown in Figure 2.

Process Control Strategies
All business processes with some degree of control have a serial correlation reflected in the process shift. Here are three process control strategies, which have risen within companies facing this issue.

Reactive Behavior: The process is reset when a data point is observed beyond the control limits (seven resets, seven defects). A properly implemented control plan is critical to retain process improvement benefits in this environment.

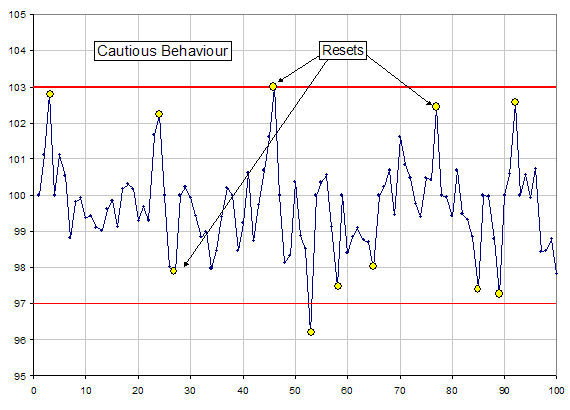
Cautious Behavior: The process is reset when a data point is observed within about 1 standard deviation (short-term) of the control limits (eleven resets, two defects). This strategy is more effective in reducing defects, however, it requires a greater amount of production interruption.

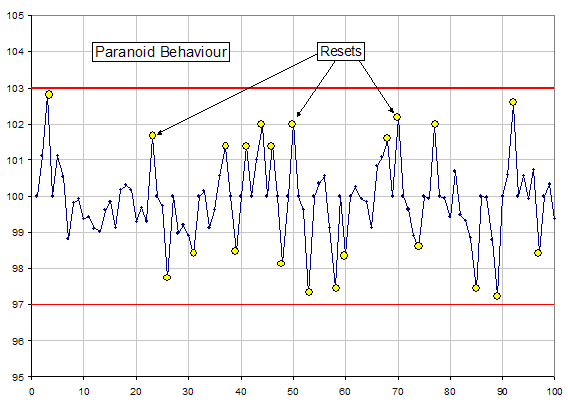
Paranoid Behavior: The process is reset when a data point is observed within about 2 standard deviations (short-term) of the control limits. (Twenty-two resets, zero defects) This strategy generates a tremendous amount of extra work and severely interrupts production when the process capability is low.
As the level of caution changes from Reactive to Cautious to Paranoid, the degree of intervention increases and the strategies become increasingly more effective in decreasing the number of defects. The relative cost of production interruption when making an adjustment versus the scrap cost of producing a defect determines which of the strategies is best for a given company.
Experienced process owners also understand that as the degree of intervention increases, they become busier and production suffers.
Conclusion
When continuous data is available, Z shift values are calculated to quantify the level of control in a process. Historical data shows that the Z shift is related to short-term process capability or short-term Z. When calculating short-term Z directly from long-term Z, an essential element is missing; information related to the level of control in the process. If some assumptions are made about the strategy used to calculate long-term Z based on the control model, a reasonable improvement target can be estimated when the existing process is controlled using SPC.