Michael Cyger ⇒
I’m always appreciative when people reach out to me on iSixSigma to share articles, opinions and significant historical events.
Today’s tidbit comes from longtime iSixSigma member and industry friend, Mike Carnell.
Here is his story, as told by Mike Carnell to me via email, paraphrased and lightly edited for clarity.
Mike Carnell ⇒

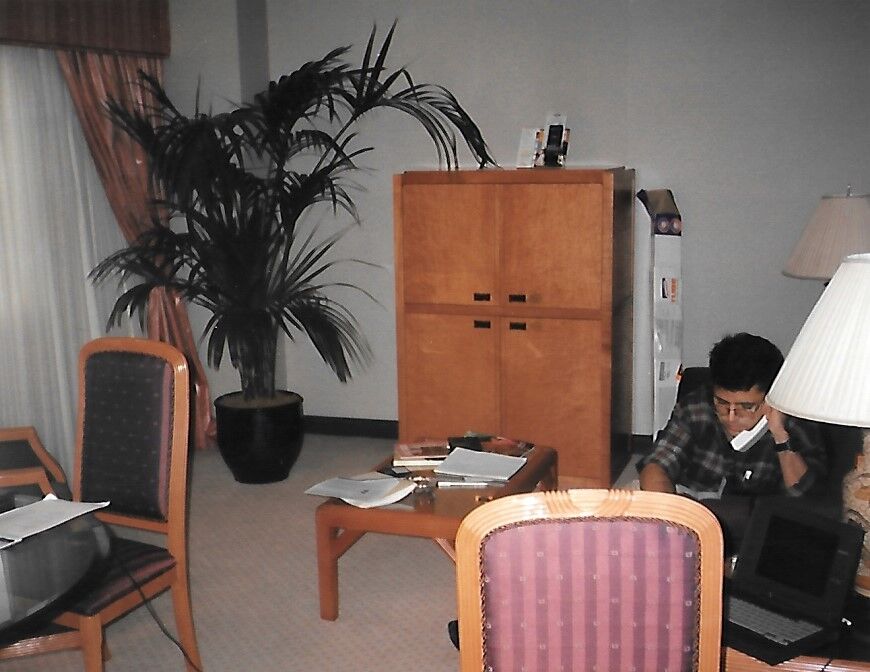
This is the Hilton Hotel in Barcelona in 1995. The guy in the picture is Miguel Hernandez – a Master Black Belt from the Allied Signal turbo charger manufacturing plant in Mexicali, Mexico.
Miguel and I were co-teaching the Analyze phase of a Spanish and Italian Six Sigma DMAIC [Define, Measure, Analyze, Improve, Control] wave.
In this picture, Miguel was on the phone with his mother, who was asking him if “the American” was being nice to him. Miguel was so smart that when he graduated college the president of Mexico gave him a medal for being smart.
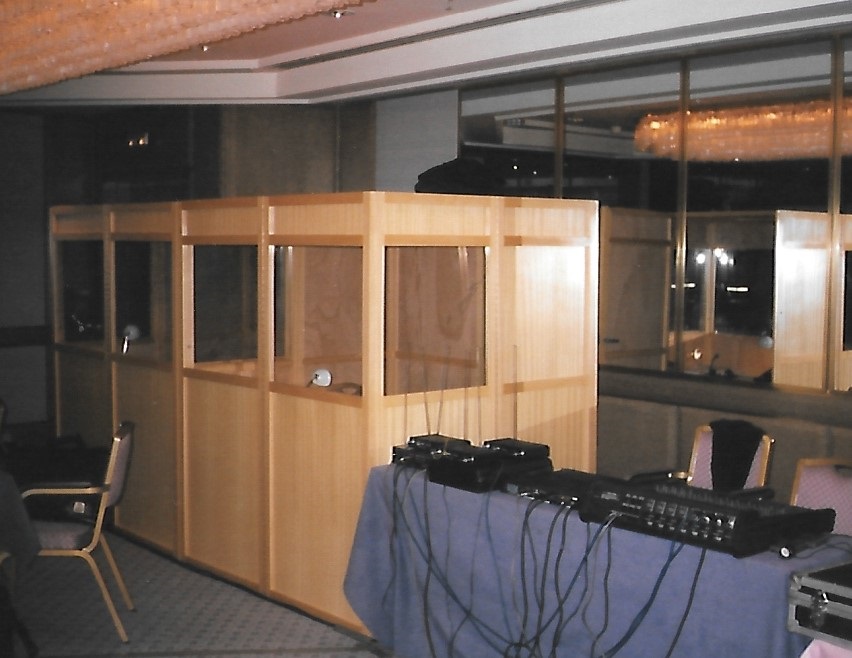
Miguel and I were both teaching in English, and Miguel could speak Spanish directly to students. Anything for the Italian students had to go through the simultaneous translators who were first language French speakers, listening to English, thinking French and speaking Italian.
Add in statistical terms and they were looking up words constantly trying to keep up with the conversation. Every time they would get frustrated, they threatened to go on strike because they were all unionized.

The translators insisted on smoking inside these little boxes they sat in at the back of the class. They got so full of smoke all you could see was an orange dot – the burning tip of their cigarettes. The longer we went between breaks the thicker the smoke. They would come out at break time with so much smoke pouring out of their clothes they looked like they were on fire.
The class was a disaster with four languages being spoken at the same time.
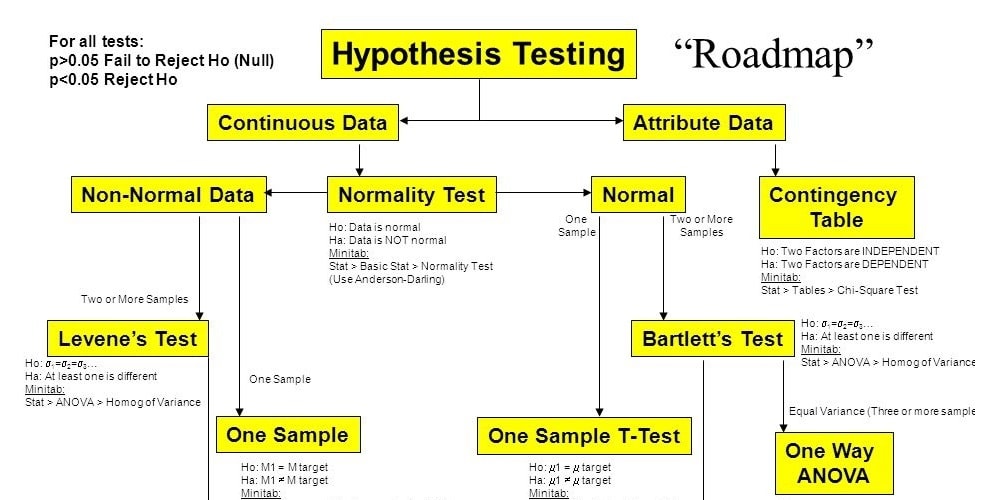
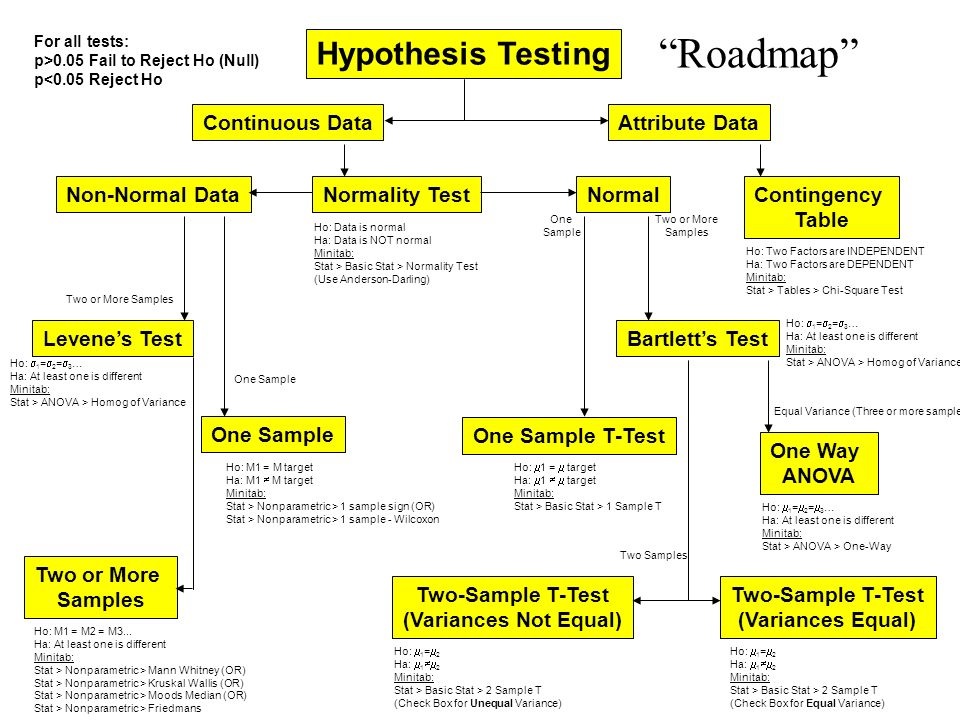
It is normally difficult to get people to understand the relationship between the tools and how to interpret the output. This is where Miguel and I created the now infamous hypothesis testing flow chart because nobody was figuring out what we needed them to understand.
We created the chart so students understood the mechanics of running a hypothesis test. Once they understood the mechanics and how to use Minitab, the whole drama thing dropped about 90 percent and the conversation became about interpreting the results.
As long as we didn’t use that “fail to reject” statistical speak, we were successful in teaching it. (Regardless of what comes out of your mouth on fail to reject, your behavior is the same as if you accepted it.)
Everything in yellow is what Miguel and I created, hand drawn on an overhead.

What we created was very basic without all the bells and whistles it has today.
I have listened over the years to people explain how the hypothesis testing flow chart was developed but the truth is it happened right there, in the Hilton Hotel in Barcelona in 1995.
It was a very long week.
Eventually the hypothesis testing flowchart made it into our Six Sigma International consulting company training material. We picked up GenCorp as a client (Jim Lambert, who was the VP of operations at Allied Signal went to GenCorp as VP of operations and took us with him) and we included the hypothesis testing flow chart in GenCorp training.
Gary Cone, another Six Sigma International principal, later hired Ilona Kirzhner for material development and training, who added the Ha and Ho stuff, and then we had a ton of statisticians who kept adding bits and pieces until it eventually became an incomprehensible science project. I never understood the issue with Ho – null hypothesis by definition means zero difference.
Miguel still works for Allied Signal, but transferred from Mexicali to Calexico, California.
As an aside, we had a meeting before the training week began where the guy in charge of the translators thought it was important to tell me: “No jokes. They do not translate well.” I asked him if I looked like someone who told jokes. He agreed that was a good point.