Category: Concepts

How Network Diagrams Improve Project Management
Updated:Diagrams can be extremely helpful as a visual aid to gain understanding of a project. This is a valuable type of diagram that you will likely come back to time and again for your team projects.
Read more »
Managing Errors: Key Strategies for a Successful Business
Updated:Errors are an issue that should be kept to a minimum, especially for those aspiring to a high Sigma level.
Read more »
The Challenges of Dealing with Concomitant Variables in Statistical Analysis
Updated:Concomitant variables are secondary variables that may affect a process under study but are not the significant parameters that the research is designed to understand or control.
Read more »
What Statistical Significance Can Tell You About Your Data
Updated:You have compared your process data before and after an improvement. Is the difference real or just noise? Statistical significance will help you answer that question.
Read more »
How to Determine and Address Common Cause Variation in Your Business
Updated:Variation and quality are not compatible with each other. The reality, however, is that anytime measurements are taken, there is going to be variation.
Read more »
Q3: What it is and How to Use it in Statistical Analysis
Updated:If you have ever taken a test and your results told you that you were in a certain percentile or quartile, you may already have a bit of an understanding of how quartiles and boxplots work. Q3 is an important part of fully understanding boxplots.
Read more »
Why Investing in Quality Assurance is Worth It
Updated:The concept of quality assurance began in the manufacturing industry and is now standard for most industries.
Read more »
The Role of Multicollinearity in Regression Model Precision
Updated:In your regression model, one thing to look for is multicolinearity. It is a problem and can cause issues when you are interpreting results.
Read more »
The Importance of Effective Auditing
Updated:In business, things aren’t always what they seem. Companies that want to see what’s really going on conduct audits to get actionable details.
Read more »
Best Practices for Accountability in the Workplace
Updated:Accountability is everything. It builds trust, reputation and responsibility and is the foundation of every good business practice.
Read more »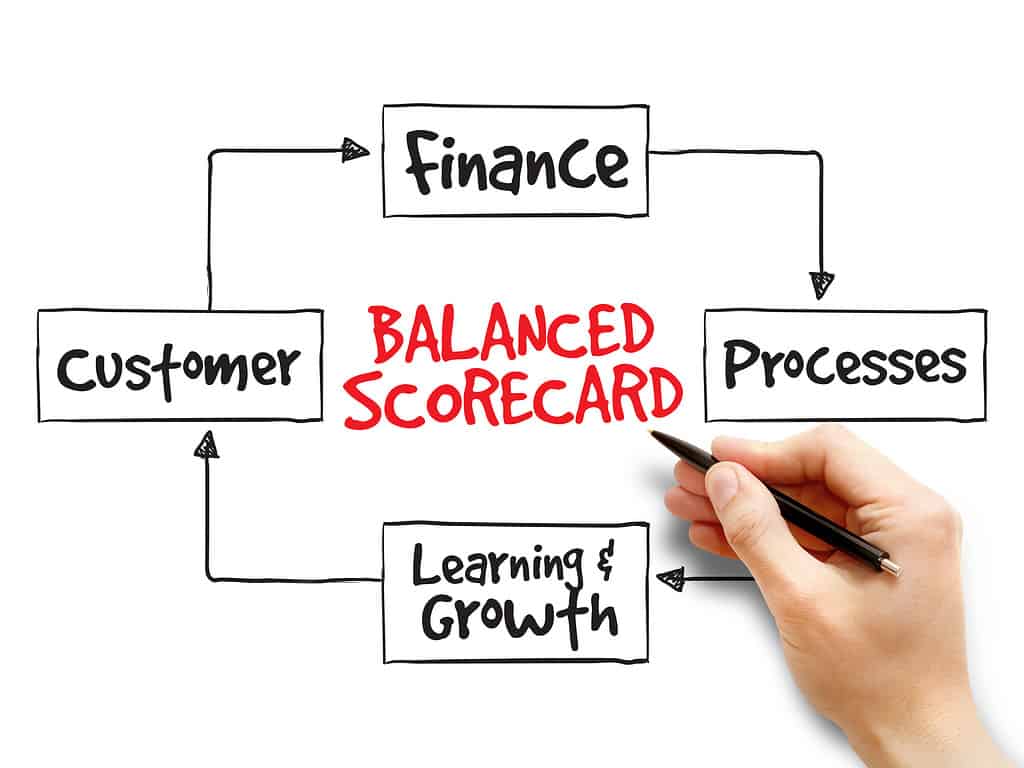
Transforming Business Performance with Balanced Scorecards
Updated:Knowing how your company is doing and where it can improve is vital to the health of your organization. Performance metrics help to accomplish this and one such metric is a balanced scorecard.
Read more »
Level the Playing Field with the Nominal Group Technique
Updated:Finding solutions to problems can often be better as a group effort. There are several group methods for addressing an issue. One option is the nominal group technique.
Read more »
How Correlation Can Help You Find the Needle in the Haystack of Business Data
Updated:Correlation analysis is central to business operations in a wide range of industries, from statistics and research, to marketing and psychology, to agriculture and physics. Even a basic understanding of the overall principles can be useful for virtually any business, in any industry.
Read more »
Why Risk Management is Important to Your Business
Updated:Every company faces risks all the time. Specific threats and priorities may change, but the need for an effective management strategy doesn’t.
Read more »
Understanding Degree of Freedom: Importance and Applications
Updated:Having enough data available for what you want to do is vital for estimates that are as precise as possible. Degree of freedom is a concept that assists in higher forms of statistical analysis.
Read more »Change Agent
Published:Business transformation and lean deployment take dedicated resources with a particular set of skills to ensure change and continuous improvement are embedded in an organization. The role of change agents has never been more vital in today’s super competitive business world, and we’ll show you why.
Read more »Artisan Process
Published:The skill of an artisan can produce unique, beautiful and innovative products, but this type of process is challenging to capitalize on in business.
Read more »
How to Make Process Performance Management Work for Your Business
Updated:You’ve heard the saying “everything is a process.” It’s a diplomatic way of saying something is taking too long, is too inconvenient, or that an outcome is out of one’s control. But processes are not carved in stone. They are meant to be continually analyzed, taken apart, cleaned up, enhanced, and optimized. And business leaders who constantly engage with their company’s processes do so because it’s how they are empowered to control every detail, every outcome, every time.
Read more »
Using Kanban to Streamline Processes and Improve Efficiency
Updated:Kanban is a tool used in Lean Manufacturing to visually manage the workflow through your processes. It is based on the concept of a pull system where things are only replaced as they are consumed.
Read more »
Quality Improvement Boosts Morale and Reduces Risks
Updated:Often in business, it becomes necessary to make changes to ensure a greater degree of quality. Just because a change is made though, does not necessarily mean an improvement has been made. Change needs to be systematic for quality to improve.
Read more »
Creating a Culture of Perpetual Improvement (Pi) in Your Business
Updated:This mathematical value is, of course, the ratio of the circumference of any circle to its diameter and is signified by the symbol π. In manufacturing, however, it can mean something else.
Read more »
Big ‘Q’
Updated:Overview: What Is Big ‘Q’? It is a strategic approach to quality improvement that focuses on the entire business rather than only seeking to improve the product itself. This management method asks every level of management to focus on exceeding customer expectations to produce global changes in how it meets market needs. Conversely, little ‘q’ […]
Read more »
Measuring Total Observed Variation: Tools and Techniques for Quality Management
Updated:Process and measurement variations should be kept to a minimum. When looking at these variations and how they are impacting your work, there is a way to group them together.
Read more »
The Role of Software Inspection in Improving Processes and Eliminating Defects
Updated:It takes a lot of testing and evaluation in order to get software ready for the marketplace. Early on in software development, clearly defined methods were put in place to ensure high-quality products that were bug-free.
Read more »