Category: Concepts

What are Transformations? A Complete Guide
Updated:Many statistical tools assume normality. Is there an option if my data is not normal? Transforming your data might help. Some statistical methods, such as hypothesis testing, have an underlying assumption of the normality of your data before they can be used. Although control charts are generally robust to normality issues, sometimes the data is […]
Read more »
Champion
Updated:When an organization attempts to implement a Six Sigma deployment, somebody needs to be selected to lead and manage it. Champions are upper-level managers who lead the execution of the Six Sigma deployment plans for the organization. That makes it one of the most critical roles in the eventual success of your Lean Six Sigma […]
Read more »
Levels
Updated:The term levels is used in the context of Design of Experiments (DOE) and refers to the different settings you can use for running your experiments. Let’s look at this in a little more detail. The purpose of doing a Design of Experiments (DOE) is to identify what variables or factors have a causal effect […]
Read more »
Sampling
Updated:It is often not possible or practical to collect all the data from your process. It can be too costly or take too much time. It may not be possible to access all the data. If this situation exists in your process, then you will need to sample your data. Overview: What is sampling? There […]
Read more »
The Ultimate Cheat Sheet for Mastering Binomial Distribution
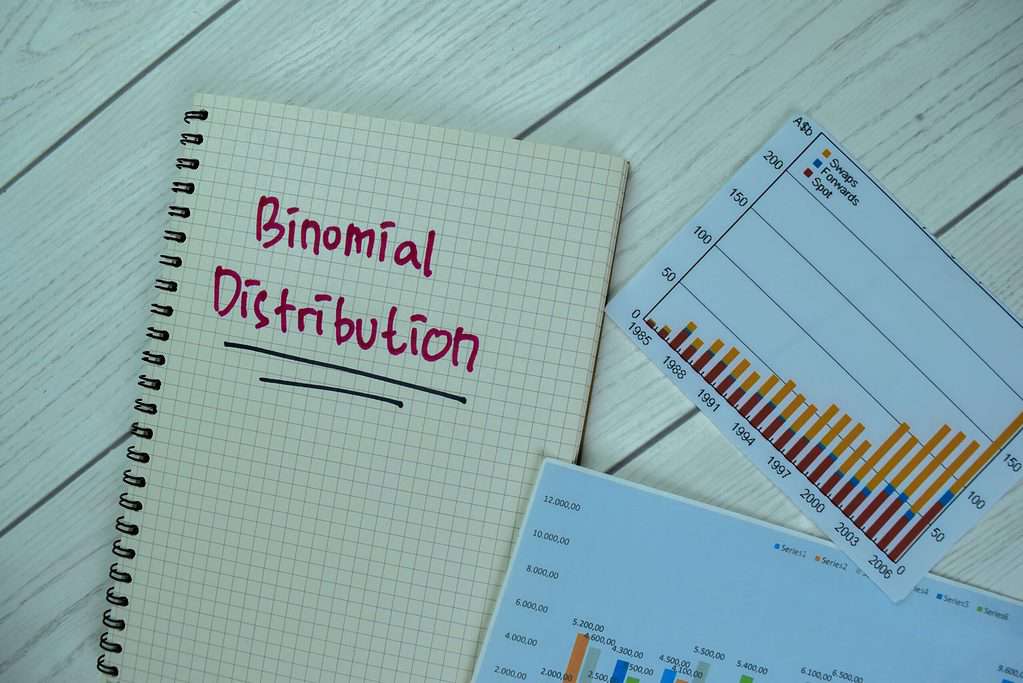
Updated:A binomial distribution can be described as the probability of a binary outcome in an activity that is repeated multiple times. It is a distribution of discrete data rather than continuous data. For example, a coin toss has only two possible discrete outcomes: heads or tails. Inspecting and testing a manufactured part can have two […]
Read more »
Make Informed Decisions with Quantitative Data
Updated:There are two broad categories of data in statistics: quantitative data and categorical data. Quantitative data is something you measure or count while categorical data presents data in categories or groups rather than the actual values themselves. Overview: What is quantitative data? Quantitative data describe values and numbers which are measured or counted and can […]
Read more »
What You Need to Know About ISO 9000 Series of Standards
Updated:ISO 9000 is a series of standards, developed and published by the International Organization for Standardization (ISO). It defines, establishes, and maintains an effective quality management system for manufacturing and service industries. Overview: What is the ISO 9000 series? ISO 9000 is a series of individual standards. The core standards contained within the series are: […]
Read more »
The Dos and Don’ts of Conducting Root Cause Analysis
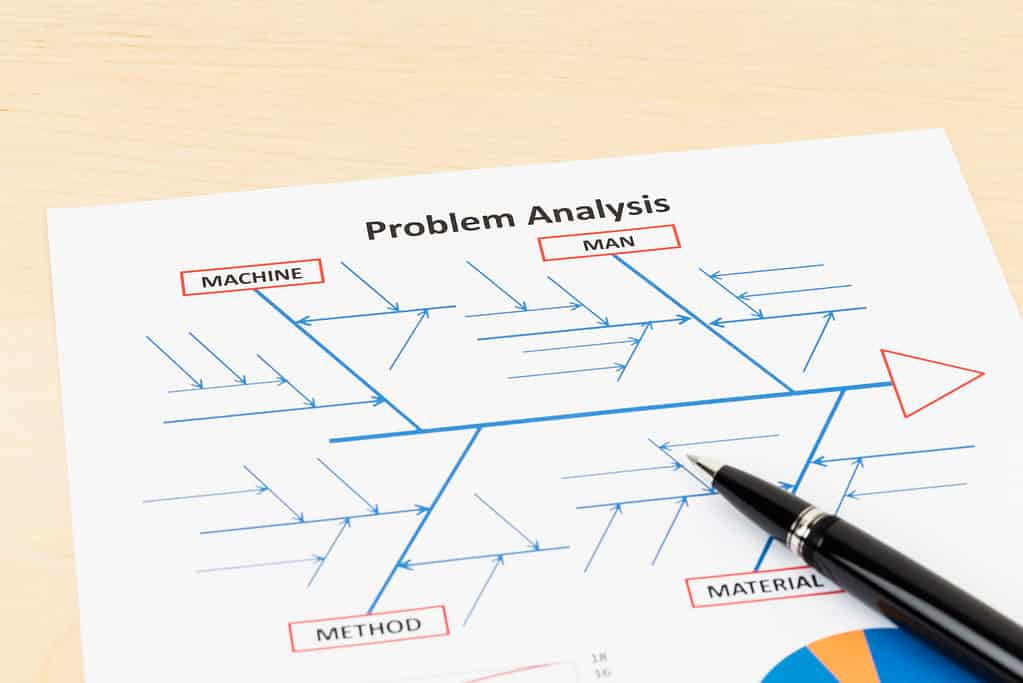
Updated:In the context of Six Sigma and Continuous Improvement, a root cause is defined as an issue or factor that causes a nonconformance or defect which, if eliminated, will improve the process. The root cause is the base issue which sets a cause-and-effect reaction in motion eventually resulting in a problem. Overview: What is root […]
Read more »
Quality Management
Updated:The strategy of continuously improving your organizational processes by setting your goals, identifying deviations from those goals, and then taking appropriate actions to adjust your processes to close the gaps.
Read more »
Quality Procrastination
Updated:Delaying quality improvement measures until the very end of a process.
Read more »
Variable
Updated:Six Sigma without variables is like a recipe without ingredients. Understanding how variables align with Six Sigma is paramount to the success of any business. Learn how variables can highlight your process’ capabilities and limitations. What are Variables in Six Sigma? Variables are essential to Six Sigma. By measuring, analyzing, and controlling the variables that […]
Read more »
Sensitivity
Updated:The degree of impact that measurable changes in input variables have on the output.
Read more »
Randomization
Updated:Randomly select factors, measurements, or variables to eliminate the effects of bias or chance.
Read more »
Queuing Theory
Updated:Queuing theory is the mathematical study of waiting in line.
Read more »
Rare Event SPC
Updated:A rare event is an occurrence that happens at such a low frequency that it cannot be monitored with traditional control charts. A rare event statistical process control chart is a tool for charting these events successfully.
Read more »
Non-Parametric Test
Updated:Tests that do not require a specific distribution to be valid.
Read more »
Interquartile Range
Updated:The difference between the first and third quartiles.
Read more »
Frequency Plot
Updated:A frequency plot is a graphical representation of the distribution of continuous data based on how often a particular value occurs.
Read more »
C-Level
Updated:A term used to describe CEO, CFO, COO, CIO, and other senior executives within an organization.
Read more »
Best Practice
Updated:When determining how to apply Six Sigma methodology to your business, you do not need to reinvent the wheel. A lot of research, testing, and work has already been put in to sort out some common best practices that are proven to work for most organizations. In any industry, there are others that have come […]
Read more »
Regression
Published:A statistical tool which allows you to predict, with varying degrees of accuracy, your output based on the values of your input.
Read more »
DOE
Published:A statistical tool for describing a causal relationship between variables using controlled experiments.
Read more »
Bar Chart
Published:A graph that represents quantified data in the form of discrete rectangular shapes.
Read more »
Quantitative Variable
Published:Quantitative data represents values and numbers which can be measured or counted and used in mathematical operations such as addition, subtraction, multiplication, or division.
Read more »