Design of experiments (DOE) is a useful tool for determining specific factors affecting defect levels in a product. A major automotive company learned just how valuable this tool is when it conducted a study of defects occurring in its alternator product. DOE was applied to identify the cause of ventilation noise within the alternator, a problem that led to customers rejecting the product.
The DOE Approach
The first step in applying the DOE principles involves identifying all possible factors considered independent variables. The alternator team identified four:
- Rotor balancing
- Claw pole
- Bracket
- Stator configuration
In order to understand the contribution of the individual factors to the noise problem, the team applied a screening design, 23 and then a factorial design 24. This was done to eliminate some factors and add others and to minimize the number of necessary noise tests.
During the screening design, the stator configuration was deemed as fixed, reacting the same in each experiment. The stator configuration was chosen for testing based on an analysis of historical data, where the shape of the stator had a great impact on the noise level of the alternator. The experiments were carried out by varying the stator once all other factors were discarded. Each factor was characterized by two levels:
- Rotor balancing: High (H) or Low (L)
- Claw pole: chamfered (C) or normal production (NP)
- Bracket: automotive firm P or automotive firm F
Rotor balancing influences ventilation noise through the rpm regime. The claw pole chamfered is the most important factor for the product development. In fact, the shape of the claw pole has a great impact on the production cost. Thus, for the firm, it is valuable to measure the noise impact of this product before changing the product characteristics and consequently the production process. The last factor is represented by the bracket.
| Order | Block | Claw Pole | Rotor Bal. | Bracket |
| 1 | 1 | NP | L | P |
| 2 | 1 | C | H | P |
| 3 | 1 | C | L | F |
| 4 | 1 | NP | H | F |
| 5 | 2 | C | L | P |
| 6 | 2 | NP | H | P |
| 7 | 2 | NP | L | F |
| 8 | 2 | C | H | F |
Conducting a DOE Analysis
At this point in the DOE analysis, the team built a statistical table comparing the combination of low and high levels for each factor. Eight runs were created in the screening design as shown in the table on the left. The team was unable to completely randomize the runs due to the experimental environment, which resided in a semi-anechoic laboratory with a high amount of mounting gig. Two types of gigs were employed with two alternative brackets. Consequently the test was conducted with a factorial design consisting of two blocks, reducing the number of mounting gigs changes.
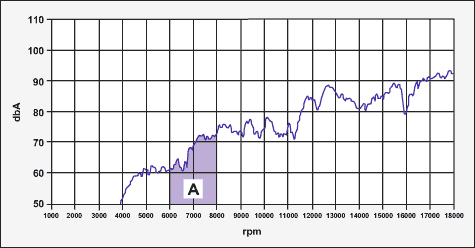
The tests were carried out following the International Standard ISO 3745-1977 for determination of sound power levels associated with noise sources. The ISO procedure specifies two laboratory methods for determining the sound power radiated by a device, machine, component or subassembly employing a laboratory anechoic room. The methods are particularly robust for rating the sound output of sources which produce steady noise and for which directivity information on the source can be collected. During the DOE analysis, the team measured the effects of the factors using the area (A) under the noise curve (Figure 1) as a response factor.

The noise curve describes the relationship between the sound pressure, dbA, and the rpm. The critical range is between 6,000 and 8,000 rpm. If the noise ventilation problem occurs in this range customers can refuse the product. The area under the noise curve for each test for the 23 factorial design is shown in the table below.
| Order |
1 |
2 |
3 |
4 |
5 |
6 |
7 |
8 |
| Area (rpm x dbA) |
42390 |
36284 |
35373 |
40084 |
37108 |
42123 |
40215 |
35353 |
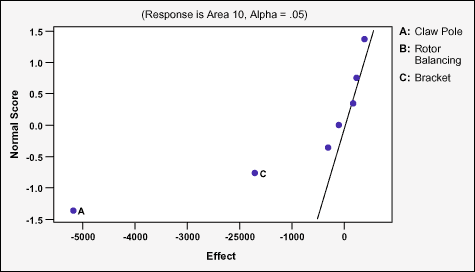
During the screening design a single-replication strategy was used to determine the factor levels. With only one replication there is no internal estimate of error. Therefore, the team concluded that certain high-order interactions were negligible and consequently combined the mean square to estimate the error. An examination of the normal probability plot for the estimates of the effects revealed that they were normally distributed with a mean of zero and a variance of sigma squared (Figure 2).

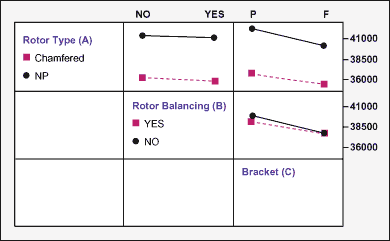
Since all the effects that lie along the line are negligible, consideration is given to the main effects of the claw pole (A) and the bracket (C). Both these effects are negative requiring a run of both factors at the high level in order to achieve the maximum reduction of ventilation noise. The interaction plot for the factors shows that there are no interaction effects (Figure 3).

|
Combination |
I |
A |
B |
AB |
C |
AC |
BC |
ABC |
|
(1) |
+ |
– |
– |
+ |
– |
+ |
+ |
– |
|
a |
+ |
+ |
– |
– |
– |
– |
+ |
+ |
|
b |
+ |
– |
+ |
– |
– |
+ |
– |
+ |
|
ab |
+ |
+ |
+ |
+ |
– |
– |
– |
– |
|
c |
+ |
– |
– |
+ |
+ |
– |
– |
+ |
|
ac |
+ |
+ |
– |
– |
+ |
+ |
– |
– |
|
ab |
+ |
– |
+ |
– |
+ |
– |
+ |
– |
|
abc |
+ |
+ |
+ |
+ |
+ |
+ |
+ |
+ |
Since the rotor balancing (B) is not a significant factor and all interactions involving the rotor balancing are negligible, it was discarded from the experiment, which then became a 22 factorial design in A and C with two replicates. The table above shows contrast constants for the 23 design by factorial effects. These results are confirmed by the analysis of variance for the data using a simplified interaction model. The first of the two tables below shows estimated effects and coefficients for area (coded units). The second table below is an analysis of variance for area (coded units).
| Term |
Effect |
Coeff. |
Se Coeff. |
P |
| Constant |
38616 |
109.5 |
0.000 |
|
|
Claw Pole |
-5173 |
-2587 |
109.5 |
0.000 |
| Bracket |
-1720 |
-860 |
109.5 |
0.001 |
| Claw Pole * Bracket |
387 |
193 |
109.5 |
0.152 |
|
Source |
Df |
Seq SS |
Adj SS |
Adj MS |
F |
P |
| Main Effects |
2 |
59447004 |
59447004 |
29723502 |
309.69 |
0.009 |
| 2-wai Interactions |
1 |
299538 |
299538 |
299538 |
3.12 |
0.152 |
Results of the DOE to this point confirmed the hypothesis of the normal probability plot of residuals (Figure 4).

The points on the plot lie reasonably close to a straight line, lending support to the team’s conclusion that both the claw pole and the bracket are the only statistically significant effects and that the underlying theoretical assumptions of the analysis are satisfied.
Conclusion: Reduction in Customer Rejections
The resolution of the problem represented an important goal for the future production strategy of the automotive firm. Application of the DOE methodology suggested that a great improvement of the product is achievable through a better shape of the claw pole as well as the bracket. As a result, the firm can expect to reduce the incidence of customer rejection of its alternator product.