All product manufacturers are being pushed to produce the best quality products without exceeding budget. Effective resource management can be instrumental in achieving this goal.
A particular textile processing mill, which dyes and prints handloom fabric predominantly used in school uniforms, decided to follow the DMAIC (Define, Measure, Analyze, Improve, Control) approach to reduce its annual expenditures. By analyzing the raw materials used in production, the mill was able to better control consumption of certain chemicals and dyes.
Define
To identify improvement opportunities in the system, the Six Sigma project team studied the various activities involved in the processing of textiles. Within the process, the improvement team found:
- Uncontrolled usage of natural resources (logs, water, electricity, diesel, lubricants)
- Unmonitored usage of dyes and chemicals, leading to higher levels of environmental pollution
- Unlimited expenses toward electrical and mechanical items
Because there can be a substantial return on investment from improved quality and from successfully employing quality as an integral part of overall business strategy, the expenses involved in the study were considered critical.
Of the various processes involved in the dyeing of fabrics, such as customer relationship development, resource planning, purchasing, production, quality control, electrical and mechanical maintenance, and housekeeping, the team chose to focus on the production process. The team found the process, which involved bleaching, dyeing, finishing and dispatching fabrics (Figure 1) to be critical.

The total expenditure involved in the purchase of various resources used for production is represented in the following equation:
Total expenditure = Dyes + chemicals + electricity + electrical items + mechanical items + logs + diesel + furnace oil + kerosene + lubricants
Measure
The data related to the purchase of these consumables was collected from log books and registers for the periods of April 2005 – March 2006 and August 2006.
Analyze
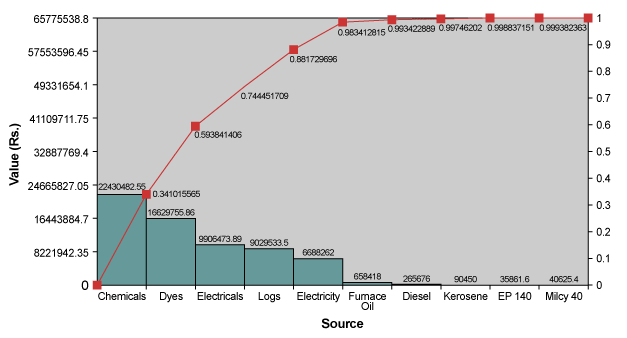
After performing a statistical analysis on the data to find the most expensive item, the team found that 59 percent of the total expenses for consumables were accounted for by chemicals and dyes (Figure 2). Of these, the more expensive item was chemicals, which accounted for 34 percent of the total costs. Hence, the consumption of these resources had to be carefully monitored for effective quality management.

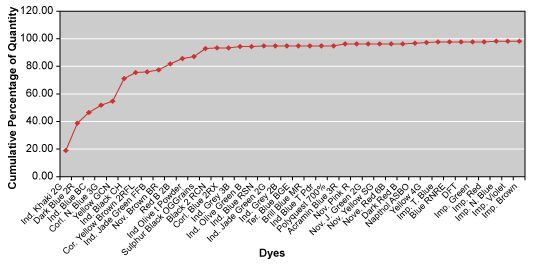
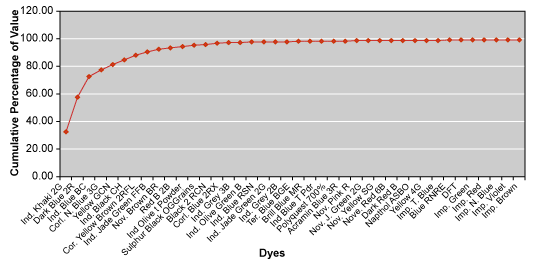
Quantity- and value-based activity-based cost (ABC) analyses also were performed on the dyes (Figures 3, 4). A list of 13 dyes that were critical by way of huge expense and consumption were obtained and the team found that Ind. Khaki 2G was the most critical of all dyes because the amount and value of the dye used had the greatest effect on quality cost. This dye was carefully examined for effective quality management.


Similarly, a list of 11 chemicals that were critical by way of expense and eight chemicals that were critical by way of consumption was obtained. The team found that caustic soda lye was the most critical of all chemicals that highly contributed to quality cost, and it was carefully examined for effective quality management.
Using the data collected, the actual consumption of the dyes was compared with the standard consumption rate and the percentage of excess consumption was obtained. The team found that Ind. Khaki 2G and Nov. Blue 2R were underconsumed by -2.29 percent and -36.66 percent respectively. The dyes Cor. Blue 2RX and Ind. Blue BC were overconsumed by 75.51 percent and 80.50 percent respectively.
Improve
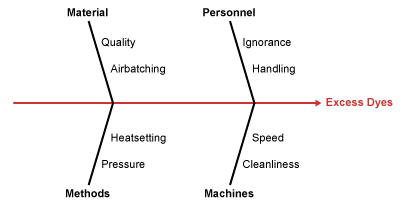
A fishbone diagram (Figure 5) was drawn to understand the excess usage of dyes. The team explained the diagram and the crucial factors that contributed to the expenses of the mill to management.

Control
A checklist (Figure 6) for the critical dyes and chemicals obtained from the analyses was distributed among all the departments of the mill, and employees were asked to monitor the level of consumption on a daily basis.
|
|||||||||||||||||||||||||||||||||||||||||||||||||||||||||||||||||
The checklist was reviewed in management meetings to ensure continuous improvement and effective quality management. Six months after the project implementation, the company succeeded in reducing its extravagant expenses by about 15 percent. With success achieved by way of the DMAIC approach, the company still continues to follow the principles of Six Sigma.