On her drive into work, Melissa Garcia was listening to Beethoven’s Piano Sonata No. 14 in C Sharp Minor and sipping on the mocha java blend she’d brewed in her kitchen just minutes before. It was a brisk fall Thursday morning, and Melissa was headed into the office where she was three weeks into her new job as the senior VP of operations for Portland’s Pacific Northwest Technology Partners (PNTP). As she maneuvered her late model sedan into the parking garage at 6:08 a.m. and navigated into the nearly empty lower level parking lot, her brakes let out a defiant squeal. “I’d better get those looked at before my trip to Mount Hood next weekend,” she thought to herself.
Melissa had recently been promoted to her new role and had transferred to company headquarters to serve in that capacity. With thoughts of yesterday’s staff meeting with her peers still filling her mind, Melissa was mentally preparing for her 10 a.m. meeting with her boss, Meifeng Li. Early in the interview process for the new role, Melissa felt she had a strong supporter in Meifeng. Meifeng was interested in Melissa’s overall prior experience, accomplishments and proven ability to transform a large organization.
PNTP Operations Mission Statement
To contribute to the success of our stakeholders through the utilization of our unique capabilities and distinct expertise.
Opportunity Statement
Meifeng’s main concern, and one of Melissa’s key challenges in her new role, was introduced as a staffing concern. PNTP’s operations unit had remained fairly consistent in size at about 600 employees. However, increasing competition was driving PNTP’s margins down. That, coupled with increasing client demands – from both new clients as well as an increase in existing client demand for their products and support services – had prompted senior staff to request Meifeng to report on the efficacy of her operation. Melissa’s prior experience provided her and Meifeng a solid foundation on which to build their approach to addressing these pressing issues.
Approach
Melissa spent a good bit of the morning reflecting on the task at hand to make sure she was properly prepared for her morning meeting. Throughout the interview process for her new role, Melissa had presented her approach to a similar business problem she had faced in her previous job. In that project, a large percentage of the highly skilled employees in her organization had expressed concern, through the annual employee feedback process, that a significant portion of their time was spent on routine and mundane client requests. These employees were wired to manage higher-complexity tasks and deliver quality service to their key strategic clients. They yearned to be able to do what they felt they did best in their jobs every day. The project took about eight months from the discovery phase to pilot and validation.
The leadership team was impressed with the approach, diligence, flexibility and focus on the employee feedback that the core project team displayed. The team took a “seek first to understand” approach and was guided by the principle to strive for simplicity in their outputs. The project plan, though comprehensive, could best be summed up as follows:
I. High-level work type analysis
II. Go deep on key activities
III. Formulate recommendations
IV. Prioritize and vet solutions
V. Pilot and validate outcomes
VI. Wide-scale implementation
VII. Sustain the gain
I. High-Level Work Type Analysis
Many of the highly skilled employees had been in their roles servicing their clients’ needs for many years. Over the course of those many years, as the clients’ needs evolved and competition to serve those needs by industry competitors rose, the employee workload had become more broad-based with wide variation. This variation stemmed from ever-increasing client demand, coupled with the clients’ varying degrees of willingness to leverage self-provisioning technologies that the company worked diligently to implement.
As an added complexity, the employees recognized that their role was largely relationship-based. Team members struggled with the client discussions that were geared toward self-provisioning solutions for the fear that they would lose the hard-earned goodwill they had garnered for serving their clients’ needs in a more personal, one-on-one fashion.
In an attempt to provide transparency to the workload environment, Melissa and the team set out to answer a seemingly simple question: “What, specifically, do our employees do for their clients every day?” With a basic understanding of their workload, the team believed they could formulate hypotheses around the type of work that:
- Could be eliminated altogether.
- May be better self-provisioned by the client and positioned appropriately (incentivized).
- Likely would be managed with more efficacy through improved technological solutions.
- Is best served remaining as activities completed by the highly skilled employees.
- Should continue to be managed internally by a more appropriately skilled resource pool.
Anchored around the annual employee feedback process, and specifically a question aimed at determining if the employees felt they had the opportunity to do what they do best every day, the project team decided to involve the employees themselves to garner insight into the activities and tasks they do each day. To meet their goal of striving for simplicity, the core project team envisioned a four-box visualization to their data findings that would be based on the activities’ frequency and complexity. They gained agreement on this approach and sought to involve as many employees in the data gathering process as necessary to gain a significant cross-section of client-types served, employee experience, tenure and a host of other related conditions.
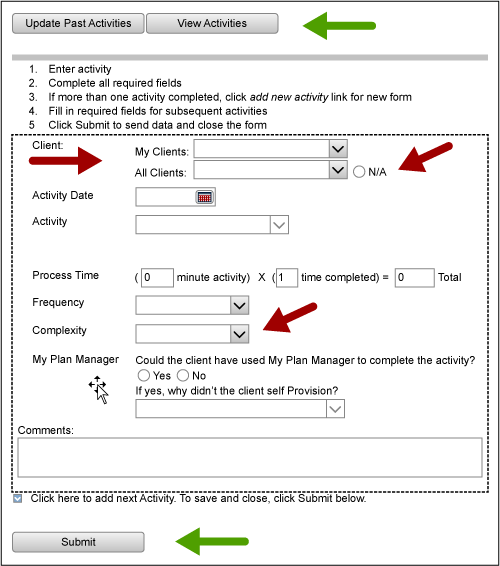
During the data collection phase, efforts focused on: creating an intuitive data collection plan template (Figure 1); generating readily understandable operational definitions for the visual display criteria being leveraged (frequency and complexity); determining the approach for choosing and training the data collectors; piloting and modifying the collection plan; collecting and reviewing the data for integrity; creating graphical displays; summarizing the findings; and reviewing the high-level findings with the leadership team.

Melissa was pleased with the fruits of the team’s efforts from the outset. Nearly 100 highly skilled employees had been trained and worked diligently to collect information on more than 5,000 activities completed during a month-long timeframe. In an effort to protect against bias, the team was also instructed on how to document activities that they partake in on pre-determined intervals, which were likely to have fallen outside of the collection period.
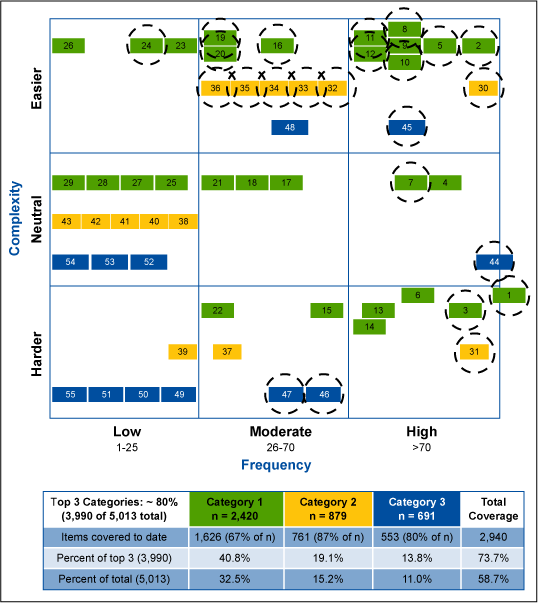
Initial analysis indicated a clear picture emerging across the frequency and complexity scales. Nearly 80 percent of the activities fit into three distinct categories (Figure 2). The evidence to maximize the use of existing technology was surfacing. And employee engagement in the overall data collection process signaled a potential strength for future communication and change management efforts.

The team set about creating their simple visual depiction of the data collection as part of their preliminary analysis. They determined a nine-box was more in line with the results, given the data definitions used while collecting the data. As per their initial project approach plans, the axes for the visual centered on frequency and complexity. The nine-box, highlighting just the top three categories, represented 80 percent of all data collected. Further, within those three categories, there were 55 distinct sub-categories of activities. The team spent a significant amount of due diligence on analyzing the data and activities of these subcategories.
II. Go Deep on Key Activities
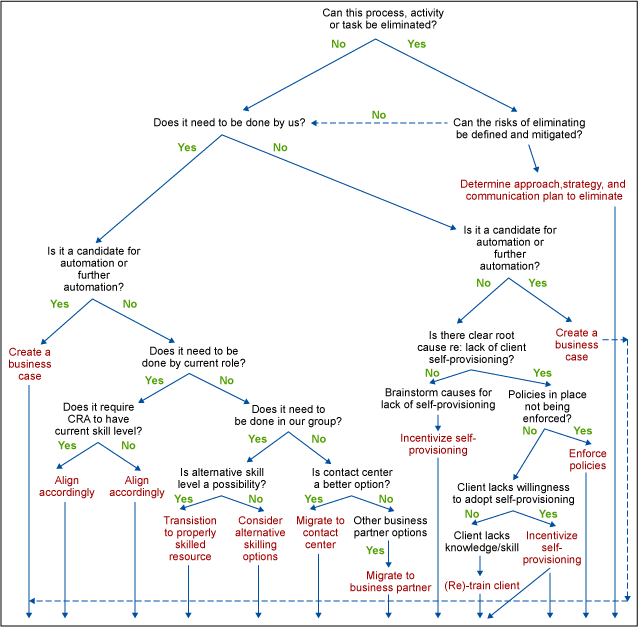
High-level analysis seemed promising. Melissa and her team had earned the green light to dig deeper on the data they had collected, were excited to begin to synthesize that data into information and, ultimately, business intelligence that could be acted upon. The team decided to create a decision tree (Figure 3) to get a more refined view of the 55 subgroups that made up the top three categories of data. The core team was divided into three workstreams, one each representing the top-three categories indicated by the data. The team created a decision tree approach that they could use to determine if the subcategorical work would “fall out” into one of the five categories listed earlier:
- Eliminate
- Increase self-provisioning by client
- Further automation candidate
- Remain in work group with existing highly skilled employees
- Remain in work group but with alternate staffing approach

III. Formulate Recommendations
With the subcategories effectively categorized into the five primary buckets laid out above, the workstream leads and their teams next set out to brainstorm potential solutions. The teams were instructed to arrive at “best case” solution scenarios based on minimal limitations to both technology spend and policy-change opportunities. This solution set would provide Melissa with an optimistic look at what could be. They were also instructed to create a “tempered expectations” solution set view based on likely benefits given significant technology spend and policy change constraints.
IV. Prioritize and Vet Solutions
Melissa continued to be pleased with the team’s progress. With this information in hand, her next step was to attain sponsor buy-in on the “best case” and “tempered expectations” exercise results. Once attained, the team set about working to:
- Further flush out solutions
- Create criteria to leverage to prioritize those solutions
- Work with the finance team to create and articulate feasible business cases
- Work with the organizational design team to frame organizational change scenarios and their implications
The team, again, turned to a simple nine-box display to articulate their position. This time, however, the axes were anchored around client impact and operational impact criteria. The team generated additional subcriteria for each of these axes as well as a weighting strategy for those subcriteria. This ensured that each potential solution was objectively weighted against each other and provided insight into the highest degree of cost/benefit impact to the organization.
V, VII and VIII. Pilot and Validate, Implement and Sustain
Based on the clear-cut evidence provided, the team gained widespread approval to pilot the most beneficial solutions. That pilot was meticulously planned and executed; the validated results exceeded initial expectations. Though there were some unforeseen bumps in the road, swift mitigation occurred and the organization moved to full-scale implementation at the conclusion of the planned pilot. As Melissa was offboarding from her prior organization, her core team was putting their control-and-response plan into place to create a measurement system and ownership structure to give them the best chance of sustaining the gains realized throughout the pilot.
It was 9:50 a.m. now. Melissa was ready to have a robust conversation with her manager in 10 minutes. She quickly called her mechanic to make an appointment for the brakes on her car, logged out of her preferred “Classical Music for Classic Rock Aficionados” desktop station, then strode confidently down the hall to her boss’ office for her one-on-one, stopping along the way to freshen up her coffee from the office breakroom.