Recently I visited several contract manufacturers (CM) to evaluate their ability to produce an electronic device that my company is developing for the automotive industry. I asked the project manager at each CM to provide me with an estimate of the typical rolled throughput yield (RTY) on their production lines.
Only one of the project managers knew the RTY on their lines. The others spoke to how they manage quality on their production lines – sharing how failed units are repaired or disposed of before shipping (so that our customers are protected). This approach makes the yield look better than it really is and increases the CM’s cost of production. That increased cost for the CM means an increased cost to the customer.
The project manager who knew his production line’s rolled throughput yield also gave me dollar amounts of lost value through wasted components and rework. At that CM, yield issues at addressed at each step in the production process with improvement teams.
A significant difference in the quotes received from the various CMs I visited was the circuit board testing schedule. Rather than test every circuit board in the production stream, as virtually all of the CMs did, the CM using RTY was able to test only 10 percent of every production run. This abbreviated schedule is a direct result of having good control of their production process. The result was the RTY CM offered the lowest quoted cost of production.
There are two ways to calculate the yield from a process. If you are evaluating CMs for a project, make sure you look hard at the way they calculate yield on their production lines and how they use the results. (If you are a CM, in particular, use rolled throughput yield and make yourself a hero of cost reduction in your business!)
First Time Yield (FTY)
First time yield, the most common way to calculate process yield, is the probability of a defect-free output from a process. This metric considers only the criteria at the end of the process. FTY is unit sensitive, meaning it does not take into account whether the output unit is defective, and is calculated by dividing the number of units produced from a process by its inputs. It does not capture how many defects were found and corrected within a single unit.
The FTY will not detect the effect of hidden factories. Consequently, it will typically indicate that a process is performing better than it really is. Even so, it is a frequently used metric in businesses because, in part, of the way some companies report their performance to financial analysts.
I was once asked to report FTY to the team that was building the yearly investor prospectus. The reason FTY was being used was related to a general accounting practice used in manufacturing where the cost of a plant’s operation is spread over all units produced, across all product lines. This practice hides already-hidden factories by burying their cost impact, allows the FTY to pass a weak reality test with investors, and protects an underperforming production line by diluting it with a line that is doing better. The calculation of FTY can useful to the business in those ways, but FTY will not help the business find and correct problems in their processes.
Rolled Throughput Yield (RTY)
Rolled throughput yield is the probability of passing all in-process criteria for each step in a process, as well as all end process criteria. RTY is defect sensitive, meaning that instead of being based on the yield on produced units, it uses the number of defects found at each process step. Mathematically, RTY is the result of multiplying together the FTYs from each process step.
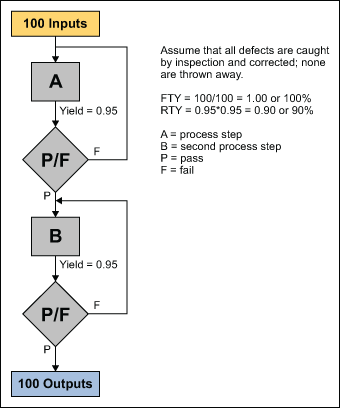
When a process step produces defects, the yield for that step will be less than 100 percent. Even if the defective outputs are corrected (a separate process step), the yield for this step is unchanged. The figure below shows the relationship between FTY and RTY.

In the example above, the FTY indicates a good process with no defects getting to the customer. There are 100 inputs and 100 outputs. The FTY does not capture the effect of the 5 percent defect rate from each of the process steps. Ten percent of the outputs are being reworked to keep customers from getting defects. The process has to do enough work to make 110 outputs to produce the resulting 100, defect-free outputs. The two hidden factories exist because of defect generation and the process owner’s desire for the customer to receive defect-free outputs. The rework (repair or replacement of the 10 defective outputs) will show up as a component of the process’s cost of poor quality.
The RTY, on the other hand, in the diagram indicates a marginal process because it captures the work done by the two hidden factories. Instead of a process in 100 percent compliance, as described by the FTY, RTY describes a process that wastes 10 percent of its resources.
These calculations demonstrate the difference between an as-we-think-it-is process and an as-is process. RTY points the way to where improvement efforts are needed.
Yielding the Way
Returning to my recent experience with contract manufacturers, I found that the yield information they gave me aligned well with their quoted cost of production. This is not a surprise based upon the way their yield calculations may have been performed.
Of course, there is more to selecting a contract manufacturer than their yield information. For example, none of the contract manufacturers had any information regarding failures in the field for devices they manufactured. This is a different yield function than the one that happens at the end of their assembly line. It is difficult to get this information, but valuable.
Whatever information and approaches are being pursued, at the end of the day, it is better to question too much than too little.