Follow Me On:

Tree Diagram
Updated:Is there a simple graphical tool for looking at a series of linked hierarchical activities? Yes, a tree diagram would be a good one to use. Let’s see how it would work. If you have a series of hierarchical tasks and subtasks to complete before you reach some objective, then a tree diagram would allow […]
Read more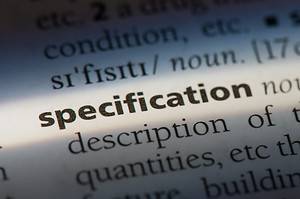
Creating Effective Specifications: What to Include and How to Structure Them
Updated:It is important that you clearly specify your expectations about a company process or product. These detailed expectations are called specifications and serve as a guide as to how well you are satisfying both internal and external expectations. A specification (spec) is a detailed description of the requirements, characteristics, and features of a product, service, […]
Read more
Standard Order
Published:The term standard order refers to the sequence of the runs you will do in your Design of Experiments. The question we will answer is whether to use the standard order or a random order.
Read more
Add Business Value to Your Organization with Total Productive Maintenance
Updated:If your machines are not working, you can’t produce products for your customers. Your customers will likely not remain your customers for very long. Let’s see how Total Productive Maintenance (TPM) can keep your equipment up and running. Total Productive Maintenance (TPM) is a maintenance strategy aimed at maximizing the productivity of equipment, machines, and […]
Read moreStable Process
Published:What do you picture when you hear the word stable? Words such as steady, consistent and minimal variation may come to mind. These words could also apply to your process. Let’s see what a stable process means.
Read more
Enhancing Data Visualization Through Stratification
Updated:Webster’s dictionary defines stratification as: formed, deposited, or arranged in stable layers or strata. That’s interesting, but how does it apply to Six Sigma? Let’s find out.
Read more
How to Choose the Right Statistical Test for Your Data
Updated:If you have a question about how your process or organization is performing, statistics will be the methodology for answering those questions. Statistics is the discipline and science used for the collection, organization, analysis, interpretation, and presentation of your data. Statistics usually fall into one of two categories: Descriptive statistics: methods used to summarize or […]
Read more
Using Variance Inflation Factor to Optimize Regression Models
Updated:The variance inflation factor measures the degree of multicollinearity of multiple predictor variables in a multiple linear regression. Holy smokes, that’s a lot of big words. Let’s find out what it all means.
Read moreUnintended Consequences
Published:If you hear someone say, “Darn, I didn’t expect that to happen”, they are probably experiencing an unintended consequence from some action they took. No one plans for things to go awry, but unfortunately, they do.
Read more
Improving Process Efficiency with Statistical Process Control
Updated:Do you want to know whether your process is in control or not? Statistical Process Control, or SPC, is the tool you want to learn about, so let’s get started.
Read more
Understanding the Response Variable
Updated:The dictionary defines a response as a reaction to something. A response variable would be defined as the reaction or effect on a dependent variable as a result of an experimental manipulation of independent variables. Response variable When discussing Design of Experiments (DOE) and Regression, you can talk about independent variables, also known as the […]
Read more
Reengineering: A Methodology to Create a More Efficient Organization
Updated:In the spirit of continuous improvement, re-engineering is the process by which you can identify, analyze, and re-design your organization’s core business processes for the purpose of achieving improvements in critical performance measures. Reengineering, also known as business process reengineering (BPR), is a methodology that focuses on the fundamental redesign of business processes to achieve […]
Read more
Using Subgrouping to Monitor Process Performance
Updated:When you speak of subgrouping, it is usually in the context of constructing a control chart. Let’s explore the topic in a little more detail. Subgrouping is a technique used in control charts to group data into smaller, more manageable sets or subgroups. The purpose of subgrouping is to increase the sensitivity of the control […]
Read moreSystem of Profound Knowledge (SoPK)
Published:Once in a lifetime, someone comes along who has a profound and transformational impact on society. Dr. W. Edwards Deming was such a person and his System of Profound Knowledge has had a significant impact on the business world.
Read moreSpaghetti Diagram
Published:The shortest distance between two places is a straight line. Unfortunately, you can’t alway do that in your work environment. Let’s see how a spaghetti diagram might help visualize how things move through your workplace.
Read moreStem and Leaf Plot
Published:It is said that a picture is worth a thousand words. You can also say a picture of your data is worth a thousand words. The stem and leaf plot is one such picture.
Read more
Regression Analysis as a Tool for Process Improvement
Updated:In the Analyze phase of DMAIC, you will want to identify possible independent or predictor variables to help explain the relationship with your response or dependent variables. Correlation is a statistical tool to establish the strength of the relationship between your independent and dependent variables. Regression is used to predict your response variable as a […]
Read more
Statistical Thinking: A Framework for Strategic Business Improvement
Updated:In 1903, famed writer H.G. Wells first described the importance of mathematical analysis. Samuel Wilks, in 1951, paraphrased Wells and developed this famous quote: “Statistical thinking will one day be as necessary for efficient citizenship as the ability to read and write.” Let’s see why he said that.
Read more
Mastering Six Sigma: A Closer Look at Six Sigma Body of Knowledge
Updated:So much to learn, and so little time to do it. The Six Sigma Body of Knowledge (SSBOK) is a collection of the tools and methodology of Six Sigma and serves as the base for most Six Sigma training and certifications.
Read more
Improving Accuracy with Sampling: Techniques and Strategies
Updated:When doing statistical analysis, it is impractical and often impossible to gather all the available data. That is when you would seek to sample the data to analyze it and make decisions about your process. In statistics, a sample refers to a group of individuals, objects, or events that are selected from a larger population […]
Read more
The Advantages of Using a Strategic Planning Process in Your Organization
Updated:Strategic planning is a formal, organized, proactive and structured process used by an organization to define its vision, goals, and objectives. The process of strategic planning also includes planning for, and the allocation of the resources needed to reach the stated goals and objectives of the organization. It is the roadmap for achieving your organization’s […]
Read moreResolution
Published:If your eyeglasses have the correct prescription, you will have proper resolution and can see clearly and with detail. The same holds true for your Measurement System Analysis and Design of Experiments. Greater resolution means your data can help you see more information about your process.
Read moreRational Subgroup
Published:The creation of a rational subgroup is the key to the proper use of control charts. Let’s try to understand what makes them rational.
Read more