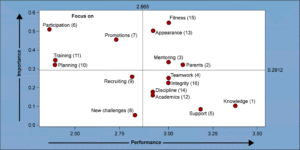
Using Quadrant Plots to Improve Program Performance
Published:When assessing areas of satisfaction within a company’s improvement program, a quadrant plot comparing importance versus performance of those areas can visually show Six Sigma project leaders where they should focus their efforts.
Read more