In many industries, improvement projects quickly face an obstacle: The lack of easy to get and reliable data. This is especially true when the critical-to-quality elements (CTQs) of the project are “soft attributes” such as taste, smell or texture.
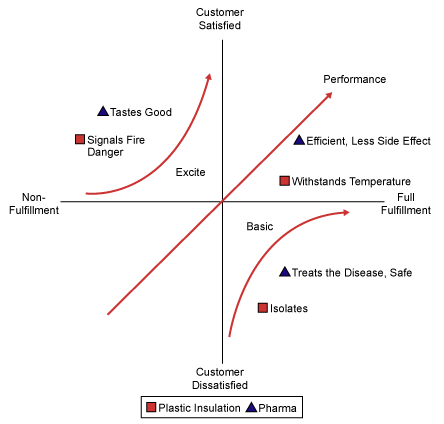
Facing such a problem in the food and drink industries is obvious. While in a Kano model taste and smell would be a “must have” for food and drink, one can easily imagine that these characteristics can be a clear differentiating factor on the “the more the better” axis in the pharmaceutical, packaging or environmental sectors. In any other industry a smell attribute can be a true delighter today but could be the company’s competitive edge tomorrow. Imagine if a consumer could smell the “just-about-to-burn” for a plastic-coated electrical wire and know to shut down the system to avoid a fire.

Traditionally, taste and smell attributes are measured by human taste panels. While the human nose is very sensitive and panels can be trained by experts, such an approach always carries considerable variation and bias over time. The process also is time consuming, costly and limited by the number of samples that can be tested. Moreover, since it can often require involving people from outside of the company, one must deal with issues like confidentiality, safety and public image. All of these issues require careful consideration, administration, as well as time, time and more time.
One could use, of course, the more common analytical measurements that can be very exact and reproducible, but they often lack the sensitivity of the human nose and require extensive knowledge of the analytical technique itself.
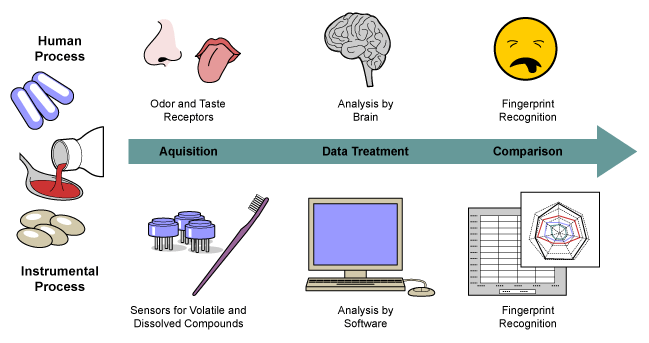
E-noses and E-tongues are measurement systems to measure smell and taste. They work the same way as humans do: They capture molecules of taste and smell on a receptor, analyze the raw data and recognize the taste and smell (Figure 2). E-noses and E-tongues have to learn the tastes and smell just as humans: If one has never tasted and seen a beer before, one would not recognize it as a beer when tasting it for first time. Once a taste is learned, the recognition is guaranteed.

An improved measurement system can help a project team across all phases of a DMAIC project where taste, smell and palatability are critical to quality.
Define
Failing to understand the voice of the customer and focusing on the wrong CTQs (not selecting the right project) is the No.1 cause of project failure, next to issues linked to team and champion involvement. With the help of E-noses and E-tongues a team can truly nail down its CTQs. For example, one would no longer talk about “sweet” or “slightly sweet” but rather a sweetness value on a scale of 1-10. The results can be correlated with human data to make this measurement as “absolute” as possible. If one cannot do that due to safety or confidentiality considerations, this will be the best relative measurement one can define. Nobody would argue that having clear and measurable CTQ’s are the foundations of the success of any project.
Measure
Measure is all about collecting the relevant data in a reliable way so one can go ahead and solve the problem in the later phase of the project. Nobody wants to spend years and thousands of dollars for data collection when running a Six Sigma project. Ideally, the team already has the data or it can be easily collected. A project team does not want to be limited by what is available, but it wants to get what it needs and it wants the data fast and reliable. The advantages of an electronic system are numerous – cycle times for one measurement are often down as much as 80 or 90 percent, with improved repeatability and reproducibility across data collection, and at a lower data acquisition cost. It is important to keep in mind that a bad odor is often an indicator of a fundamental quality and process problem like residual solvents in ink for food packaging. Having the right data ready for analysis puts a team half way through project success.
Analyze

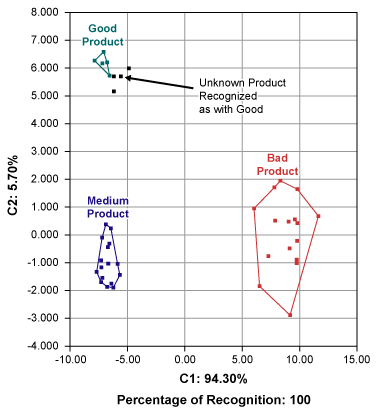
Smell and taste attributes are complex to analyze. Unlike weight or distance that can be measured in absolute and specific terms, taste and smell is an outcome of pattern recognition of signals across multiple non-specific receptors. E-noses and E-tongues not only provide raw data, but also provide powerful statistical analyses. With the help of multivariate statistics such as principal component analysis (PCA) and discriminating factor analysis (DFA) the results are translated into easily communicable “taste maps” or “odor maps.” The DFA model (Figure 3) seeks to visualize the maximum discrimination power between groups.
In the example of a DFA model, different quality levels can be clearly distinguished and unknown products can be qualified. Just as in hypothesis testing, through comparing the “within” variation and the “in between” variation, the discrimination power and the certainty of the recognition can be calculated. In this case, recognition is 100 percent.
Of course, any raw or processed data can be easily imported into statistical software or a spreadsheet for further analysis as required by the project. The electronic system makes life easier by producing the “must have” analysis while the team keeps the flexibility to analyze data and map out the most important cause-effect relationships. This sets a solid foundation for the improve phase to make objective and informed decisions on the implementation plan.
Improve
Once the team has shown with solid data and sound data analysis what the real problem is, it can implement quick-wins and develop solutions. The relative feasibility of the measurement also allows for sophisticated design of experiments (DOE) to find optimal process conditions. Lean benefits are automatically harvested by reducing cycle time and waste in changeover situation. The quick wins will help the team to keep the momentum of its project in the early phases while the DOE will help the team to find the optimal conditions on a long term.
Control
Simple and robust – if the team gets these two things right, it will have half won the control battle. One can and must do as much sophisticated analysis in the Analyze phase as needed to solve the problem. However, once the changes are implemented the control has to be simple and without the use of additional statistical software.
E-noses and E-tongues give the team simple control techniques such as soft independent modelling class analogy (SIMCA) for good/bad discrimination, partial least square (PLS) models for quantification as well as statistical process control charts (SPC) for monitoring the process over time. In a situation where the company would only know the problem based on customer feedback or through lengthy human panel process, the best a company can be is reactive. Statistical process control based on the E-nose enables the company to take charge, be proactive, and better serve its customers.
In summary, improving the measurement system allows a Six Sigma team to focus on the right issue, increase its chances of project success or simply provide day-to-day operations with a tool that helps them in continuous improvement effort. What is measured gets done.