
Magda, the Master Black Belt at a manufacturing plant in the Midwest, was sitting in her office one day in April 2005, when the plant accountant and her good friend, Jeff, burst into her office crying, “They’re going to throw me in jail!”
“Calm down, Jeff,” she said. “What’s going on.”
Jeff blurted out, “Our auditors told us we had to put in Sarbanes-Oxley (SOX) controls for our month end close. You’ve heard of SOX, haven’t you? That’s the congressional act that says company leaders can be held legally responsible for the accuracy of their company’s financial reports.”
“Yes, I’m familiar with Sarbanes-Oxley,” Magda replied. “I take it you’ve put in some controls and think they aren’t working?”
He thrust a sheet of paper at Magda that had several columns of numbers. “See for yourself! We put those SOX controls in at the beginning of 2004, and it seemed they were working for awhile, but now, look! It’s broken…we’re going to jail.”
Magda looked at the columns of numbers. “First thing to do,” she said, “is get these numbers into a form where we can tell what’s really going on.” She quickly plugged them into her statistics software and came up with a control chart (Figure 1).
“Jeff, I’m not sure I see anything wrong here. The chart shows absolutely no indication of any out-of-control signals,” said Magda.
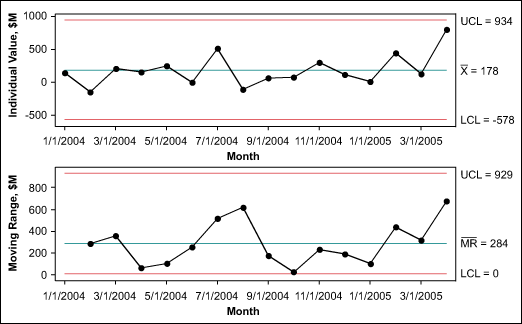
Jeff was looking glum. “But I promised the accountants that I would never have any variances bigger than $100,000,” he said. “And look…we’re off by that amount or much more practically every month. And this month we were off by nearly $800,000. I’m going to jail!”
Knowing that the plant did about $2 million in transactions every day, Magda had an obvious question. “Where did the plus-or-minus 100k come from?” she asked?
“I just thought it sounded good,” said Jeff.
Diagnosing the Problem
“OK,” said Magda. “Let’s start with the basics. Where do these figures come from?”
Jeff grabbed a sheet of paper off Magda’s desk and sketched out the diagram in Figure 2. He explained that month-end closing was exactly what it sounded like: His group had to make sure that the records of goods taken in (what they called “goods receipted”), and goods that moved out of the plant either by being sold or by becoming a part of a product shipped to another plant (“goods issued”) matched up at the end of each month.
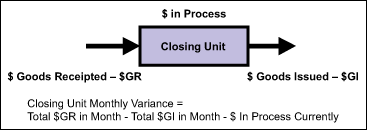
When Magda probed about the reasons for variances, it became clear that Jeff had no idea what exactly was happening. (She also clarified that what accountants call “variances” is simply another term for “discrepancy,” and not the statistical term that she was used to.) So the two of them convened a meeting that included Jeff’s “three budgeteers” and several others who input the data.
At the start of the meeting, Magda asked to see the closing variance data for the time period before 2004. The data was pulled up and quickly charted. It was immediately obvious that the data after the start of 2004, when the SOX controls were put in place, was the same as the data before 2004. The control limits were the same.
“Well, Jeff,” said Magda, “I guess I have to agree with you on one point – your SOX ‘controls’ haven’t made any difference in the process. But the good news is that your process seems to be in statistical control.”
Jeff was still looking queasy. “The auditors are going to be in next month. What am I going to tell them about these big variances?” he asked.
Magda looked around the room. “If the variations are too big, we can do some root cause analysis to try to narrow them,” she said. “This is going to take time, so you all had better clear your calendars.”
During the next few days, the team mapped the process and checked on the voice of the customer – in this case, what the auditors wanted and, more importantly, what Sarbanes-Oxley required. It was clear that Sarbanes-Oxley, while non-specific in how-to’s, requires companies to have accurate controls over their month-end financial reporting. The auditors insisted only that local accountants set the appropriate trigger range for investigating month-end closing variances.
Finding Solutions
The goal was clear. The team needed to reduce common cause variation in the month-end closing. As Black Belts know, this requires that the team look at factors that are present in the process all the time and how they influence variation. The team began by creating a Pareto chart of the amount of the control limits that was attributable to each business unit in the plant (referred to as “closing units” for accounting purposes). The result is shown in Figure 3.
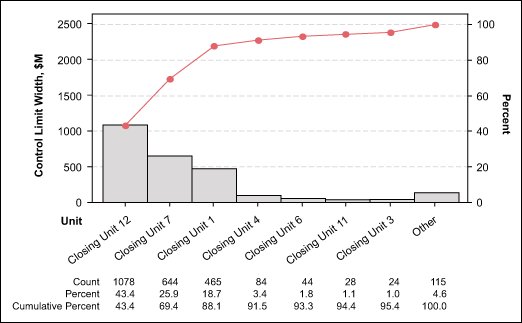
What the team members found was a classic Pareto effect: Only a few of the potential sources of variation accounted for more than 80 percent of the results. It was clear that Closing Units 1, 7 and 12 had the most variation in the process. They set about doing root cause analysis to discover why the variation in these units was so big.
In Unit 1, they found that the manager insisted on approving all incoming goods receipted – often requiring a visual inspection and count – before the receipt of those materials could be recorded electronically. When pushed, the manager admitted that his visual counts never varied from the paperwork he had, and he agreed that this extra step could be removed. All transactions could be recorded immediately, which essentially eliminated all the variances for that unit.
For Unit 7, the team discovered that the data was not normal – it had a sawtooth pattern, alternating up, down, up, down, which gave a bimodal histogram (Figure 4).
The root cause they discovered for Unit 7 was that the amount of in-process transactions (work in process, or WIP) was not accounted for, even though, according to standard procedures, it was supposed to be. The problem was not entirely the fault of Unit 7 – it was Unit 1 that did not count WIP, so the Unit 7 personnel were constantly trying to manually adjust for the lack of in-process transactions. The solution was to add the WIP calculation into the month-end closing.
The major root cause for Unit 12 was that it often had goods-issued transactions that had not been goods receipted yet – that is, material had already left the plant before it was officially received. Part of the problem was that the supplier was not synchronized with the site. The supplier was supposed to send electronic notification of materials sent to the plant, but often failed to do so in a timely manner. And the plant’s system was set up so that materials could not be “receipted” until they got that notification from the supplier. The solution was to work with the supplier to fix the synchronization.
Evaluating the Results
Under typical conditions – doing the month-end closings only at month’s end – the team would have to wait a year or more to statistically show that the changes made had had the desired effect. Since the process of closing did not affect what was really going on in the process, the team decided to the closing calculations daily so it could generate more data points.
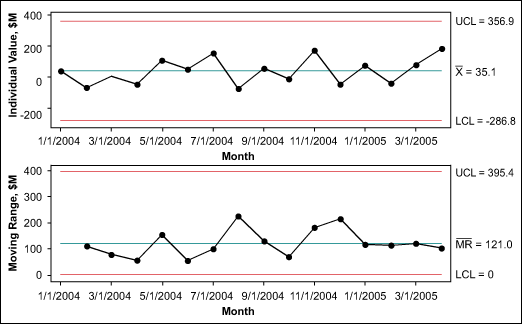
The results from the first month following the changes described above are shown in Figure 5. Data from the rest of the year maintained the same pattern as seen in April 2005 – much less variation, centered around the average of $182,000. (A test for equal variances was run on the two populations and the hypothesis was rejected, p=0.006 for Levene’s test.)
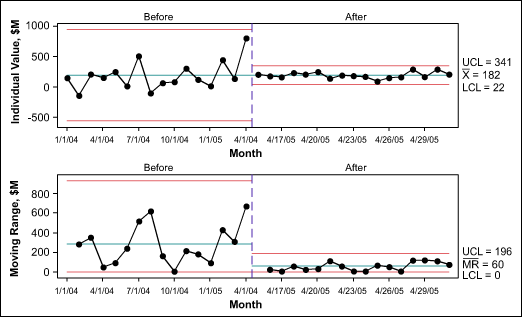
Even with the improved process, the control limits were not within the plus or minus $100,000 that Jeff had promised to the auditors, but both he and the auditors were comfortable with the new control plan.
In a debriefing on this project, Magda pointed out the following lessons to Jeff, the other accountants, and plant management:
- Sarbanes-Oxley requires companies to accurately control their financial reporting and holds executive management responsible for these controls.
- Financial processes are just that – processes. They can be improved using Lean Six Sigma, just like any other process. Statistical process control charts are especially effective ways of monitoring the performance processes, including those in finance.
- Segmenting inputs to financial measures is often helpful in identifying the key suspects in performance variation.
- Some financial measures (like variances and controls) sound like statistical terms though they are completely different. Operational definitions are needed to prevent confusion.