Selecting the right type of control chart is a vital starting point for statistical process control (SPC). Which chart to use depends mainly on the classification of the data, the type of underlying distribution and the intent of the application. Selecting the wrong type can result in many false alarms, leading to expensive and fruitless searches for assignable causes. With the wide range of control chart options available, the selection of the chart that best suits a particular process can be a difficult task.
The confusion increases with applicability of two different control charts for the same data. This is particularly the case when using time-weighted control charts. For example, the same data set can be analyzed using an individual-moving range (I-MR) chart as well as time-weighted control charts like an exponentially weighted moving average (EWMA) chart or a cumulative sum (cusum) control chart. Yet, the intent and method of application for both types of time-weighted charts are entirely different. Practitioners often do not focus enough on the “intent” of using a particular type of control chart which may lead to incorrect interpretation of results. When and how to use a time-weighted control chart has always been an area of confusion for quality supervisors in production lines (operational understanding) as well as SPC practitioners (comparison of statistical performance).
Example of Different Control Charts Results
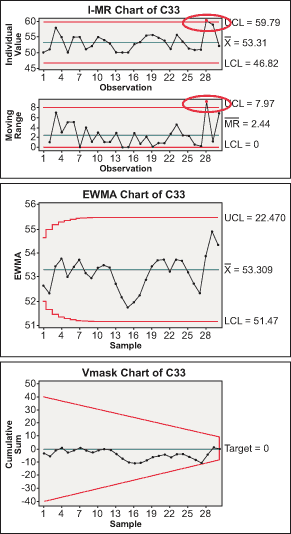
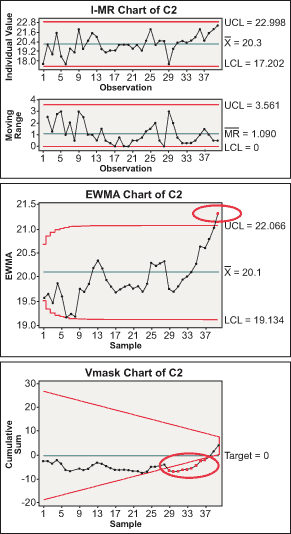
The following data sets provide an example of the different conclusions reached by two different control charts. The data is analyzed using an I-MR chart as well as an EWMA chart and the inferences drawn are contradictory. It is tough to make a decision if the intent of the analysis is not understood.


Comparison of Statistical Performance
A major disadvantage of the Shewhart-type control charts is that they only use information about the process in the last plotted point and therefore these charts have no memory. Previous observations do not influence the probability of future out-of-control signals. Trend rules or zone rules may be used to introduce some memory which results in faster detection of small shifts.
Time-weighted control charts are an alternative to Shewhart charts for tracking small shifts in a process. As opposed to Shewhart charts, they make use of historical data points and quickly detect small shifts (of order less than 3 sigma).
Roadmap for Time-weighted Control Charts
Though time-weighted control charts are very useful, they are not meant to completely replace the Shewhart charts, which can be used to detect a wider assortment of effects (shifts of 3 sigma or higher order) that are due to assignable causes. It is frequently recommended that Shewhart limits be used in conjunction with a EWMA or cusum chart.
The intent of using a control chart for analysis has to be well understood beforehand. Two important questions to be answered are:
- Is the team specifically looking for detection of relatively small shifts in the process?
- How small a shift (of order of 1 or 2 sigma) is significant for the process?
Answering these questions helps make clear the intent of using time-weighted control charts. It determines parameters (weight for EWMA charts and shift and slack for cusum charts) of time-weighted charts and analyzes the data set accordingly.
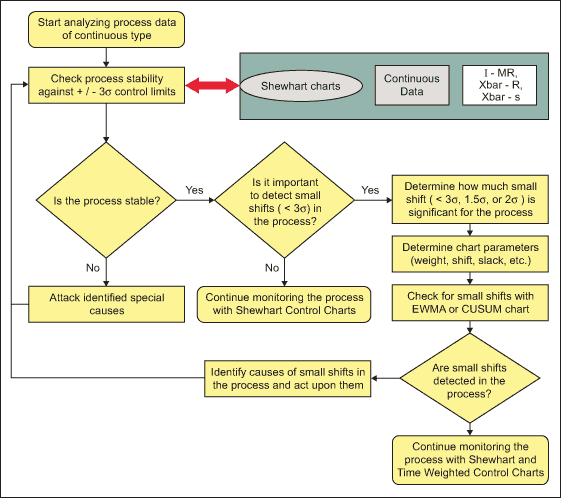
Project teams should start with a Shewhart control chart for obvious process instability, if any, and then use a time-weighted control chart for determining small shifts in process. The roadmap for using time-weighted control charts in conjunction with Shewhart control charts is below:

Conclusion: Two Control Charts Better Than One
Time-weighted control charts are a good alternative to Shewhart control charts for detecting small shifts quickly. However, the user must be clear about the intent of using these control charts. The roadmap, which was developed through practical experience, helps achieving better results by using both Shewhart and time-weighted control charts.