The following is Part One of a two-part article. Part One follows the first two phases of a DMAIC (Define, Measure, Analyze, Improve, Control) project at Kahiki Foods. Part Two follows the completion of the project – the Analyze, Improve and Control phases.
Kahiki Foods, a family-run Asian foods manufacturer with about 200 employees in Gahanna, Ohio, USA, had an excessive amount of waste on their chicken nugget product line; their average daily waste was 9.72 percent. That waste correlates to a loss in raw materials of $601,170 annually. By redesigning the waste tracking system, identifying root causes and then implementing prioritized solution elements, the business predicts an annual savings of $178,042 and a 24-percent decrease in the daily waste percentage.
Define
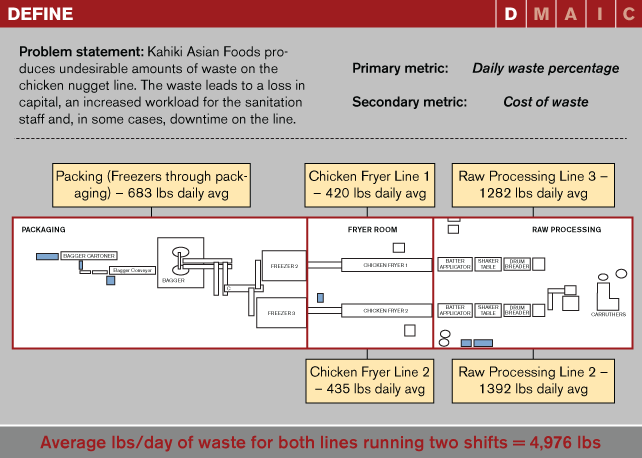
Kahiki Foods had extreme amounts of daily waste on their chicken nugget lines. The daily amount of waste on the line averaged 4,976 pounds (for two production lines running two shifts) – more than Kahiki’s two other major product lines combined. The initial project goal was to create a 50-percent reduction in the primary metric of daily waste percentage.
The project was scoped to encompass the beginning of processing (at the Carruthers machine, a chicken dicer) through to the end of palletizing. Waste was defined to include all food materials collected in red inedible bins, machines and on the floor, and to exclude packaging material. The members of the core team included a process improvement engineer, line leads and production managers, as well as employees from R&D, finance and scheduling. A kick-off meeting was held with the core team, in which members used multivoting to identify where they believed the most waste was being created and where the most opportunity for improvement existed. This information was used to help focus attention when observing the process, while also promoting a better understanding of the process.
The team created a SIPOC (suppliers, input, process, output, customers) map as a visual representation of the value stream, and identified the material input and output at each machine in the process. From this, the types of waste being created at points throughout the line could be identified, along with the cost of these types of waste per pound.

Measure
The goal of the Measure phase in this project was to determine what data would need to be collected to understand the current state and the impact that potential Xs had on the Y (daily waste percentage). The team developed a measurement plan after considering the following questions:
- Which metrics need to be tracked?
- Were the metrics already being captured?
- If not, what measurement method should be used for data capture and who would own the information?
The three primary metrics for this project were:
- The daily waste percentage,
- The amount of waste being created in zoned areas on the line, and
- The composition of waste in these areas.
The daily waste percentage was a metric already calculated by Kahiki and tracked on their KPI (key performance indicator) dashboard. The daily waste percentage was calculated by dividing the total amount of waste for the nugget line (pounds) by the total amount produced on the bagger (pounds).
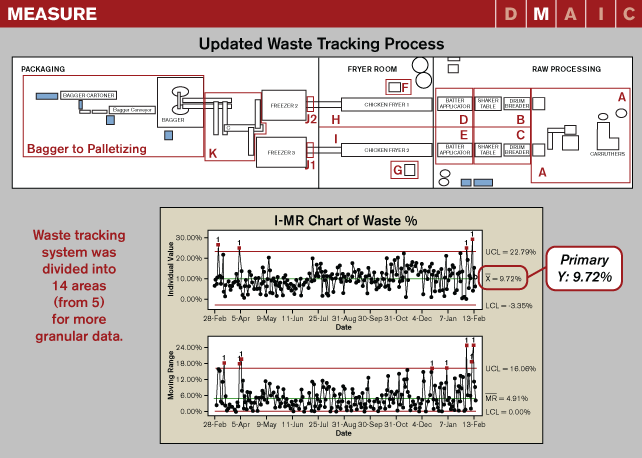
The existing waste tracking system divided the line into five areas and recorded the waste for those five zones (Figure 1). The team realized that to better understand where the greatest opportunities for improvement existed, more granularity was needed in the waste tracking system. The updated system divided the line into 14 areas based on what type of waste was being created within those zones. The division of areas is shown in the floor layout diagram in Figure 2. The daily waste tracking forms were updated to depict the changes in waste collection areas; the sanitation staff would record the time of collection and amount of waste under the appropriate column.
To distinguish among the zones, a letter was assigned to each area and painted on the floor in the relevant area, labeled trashcans were placed in each section, and the corresponding letter was added to the column headers of the waste tracking forms. It was important to assign a symbol – in this case, a letter – to each updated area because the majority of the sanitation staff and operators did not speak English. The sanitation staff was trained on the updated system and the system was implemented on February 8, 2012.
The third key metric for this project was the composition of waste in certain waste tracking areas; it was unknown how much usable product was being lost at these points. The waste composition study was needed to determine the associated loss in capital for each area. The areas to be included in the waste composition study were:
- Batter applicators: percent of batter versus percent of chicken
- Fryers: percent of tempura nuggets versus percent of crumb and grit
- Freezer entrances: percent of tempura nuggets versus percent of crumb and grit
The study was set up so that 20 data points would be captured – 10 for each line. The study collected data from both shifts and ran for two months, from February 16 to April 16.
In addition to these other steps in the Measure phase, the team created a run chart from which they determined that the average daily waste percentage on the line was 9.72. An I-MR chart showed the process to be out of control. With the additional information gathered to date, a process capability study was performed that showed 83.65 percent of days had a daily waste percentage out of spec. The Cpk was calculated to be -0.34, indicating that the center of the process far exceeded the desired center. Its value of less than 1 meant that the variability of the process was greater than the size of the desired range.

Author’s note: Scott Sink, Director for the Integrated LeanSigma Certification Program in the College of Engineering/Integrated Systems Engineering (ISE) and Joe Cerrato, BSISE and Black Belt, The Poirier Group, served as Ms. Kinneberg’s coaches on the project. Special thanks to Tony Jones and Kahiki Foods for their continued support of the ISE Program and its candidates.