
© ESB Professional/Shutterstock.com
Key Points
- Process Flow Diagrams focus on visualizing workflows by mapping the sequence of steps, decision points, and handoffs in a process. These diagrams highlight bottlenecks and inefficiencies without incorporating time or value metrics explicitly.
- Swimlane Diagrams use horizontal or vertical lanes to organize processes based on roles, departments, or teams, making identifying cross-functional dependencies and redundancies easier.
- Spaghetti Diagrams emphasize the physical movement of materials or information through a process, helping to pinpoint areas where excessive transportation or motion waste occurs in a workspace’s layout.
- Business Process Modeling Notation (BPMN) offers a standardized approach to visualizing complex workflows. It uses symbols to represent tasks, events, and decision gateways, allowing for detailed process analysis and automation opportunities.
Value Stream Mapping (VSM): An Overview

Value Stream Mapping (VSM) is a Lean management tool used to visualize, analyze, and optimize the flow of materials and information required to deliver a product or service to customers. It helps identify inefficiencies, bottlenecks, and waste in the process, enabling teams to improve value delivery and reduce lead times.
Key Elements of VSM
- Customer Demand defines the customer’s requirements, often expressed in terms of demand rate or takt time.
- Process Steps represent all activities in the workflow, from initial inputs to final delivery.
- Material Flow tracks the movement of physical materials or work-in-progress (WIP) through the process.
- Information Flow captures communication channels, such as orders or scheduling, that guide the process.
- Metrics include performance indicators like lead time, cycle time, and inventory levels for each step.
How to Construct a VSM
- Choose a specific product or service to map.
- Establish the start and end points of the process.
- Observe and record all process steps, material flows, and information exchanges, including metrics.
- Identify delays, rework, and inefficiencies in the current state.
- Develop an optimized version of the map with improved workflows and reduced waste.
- Execute improvements and revisit the VSM periodically to sustain progress.
VSM provides a clear, actionable visualization of the value delivery process, fostering collaboration and continuous improvement. While VSM is powerful, it may not always suit every scenario, organization, or challenge. Fortunately, several effective alternatives can serve similar purposes, enabling teams to improve processes, eliminate waste, and optimize performance. Here, we explore six alternatives, describing their use, benefits, and examples to illustrate their application.
Alternatives to Value Stream Mapping
1. Process Mapping
Process mapping is a straightforward visualization tool compared to VSM. It focuses on the detailed steps in a specific process, without necessarily considering the overall value chain or supply chain. This method is effective for smaller teams or when addressing individual workflows or subprocesses.
Example:
The customer service department identifies a high rate of delayed responses to customer inquiries. By creating a process map, they discover that multiple approval stages are unnecessarily duplicative. The team eliminates redundant steps, streamlines decision-making, and reduces the response time by 30%.
Benefits:
- Easier to understand for teams unfamiliar with Lean principles.
- Ideal for solving isolated issues in smaller processes.
- It expands into larger analyses, including VSM, if needed.
2. Swimlane Diagrams
Swimlane diagrams, also called cross-functional flowcharts, are designed to illustrate workflows while identifying responsibilities across different departments or individuals. These diagrams organize processes into lanes, making it easier to spot bottlenecks, handoff delays, and inefficiencies.
Example:
In a hospital setting, a team uses a swimlane diagram to analyze patient admission and discharge processes. The diagram reveals long handoff times between the nursing staff and the billing department. After aligning their processes, the hospital reduces patient discharge times by 25%.
Benefits:
- Highlights who is responsible for each part of the process.
- Encourages cross-departmental discussions to eliminate silos.
- Visualizes the entire workflow and shows where tasks overlap.
3. SIPOC Analysis
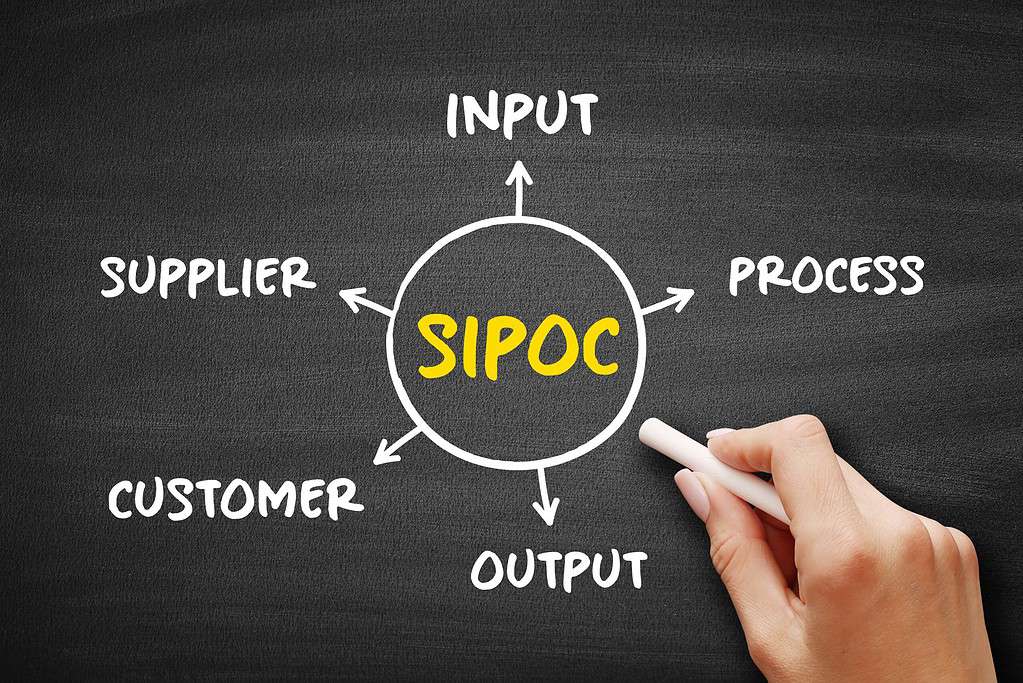
SIPOC (Suppliers, Inputs, Processes, Outputs, and Customers) is a high-level tool used to outline the essential components of a process. It’s particularly effective during the early stages of process improvement to establish scope and ensure alignment among stakeholders.
Example:
A manufacturing company uses SIPOC to identify delays in product assembly. By listing suppliers, inputs, processes, outputs, and customers, the team identifies that inconsistent raw material delivery from suppliers is the primary issue. Switching to a more reliable supplier reduces delays by 40%.
Benefits:
- Focuses on the big picture, making it easier to set priorities.
- Ensures all stakeholders agree on the scope of improvement.
- Provides a structured approach without requiring complex tools.
4. Kanban Boards
Kanban boards are visual management tools that help teams monitor workflow in real-time. Tasks are represented on cards and moved through columns representing stages of the process, such as “To Do,” “In Progress,” and “Done.” Kanban emphasizes limiting work-in-progress to reduce bottlenecks.
Example:
A software development team implements a Kanban board to track bug fixes. By visualizing tasks and capping the number of simultaneous fixes, they reduce backlog and improve resolution times by 50%.
Benefits:
- Provides a dynamic view of ongoing tasks.
- Works well for various industries, especially Agile environments.
- Prevents overloading team capacity and minimizes idle time.
5. The 5 Whys Analysis
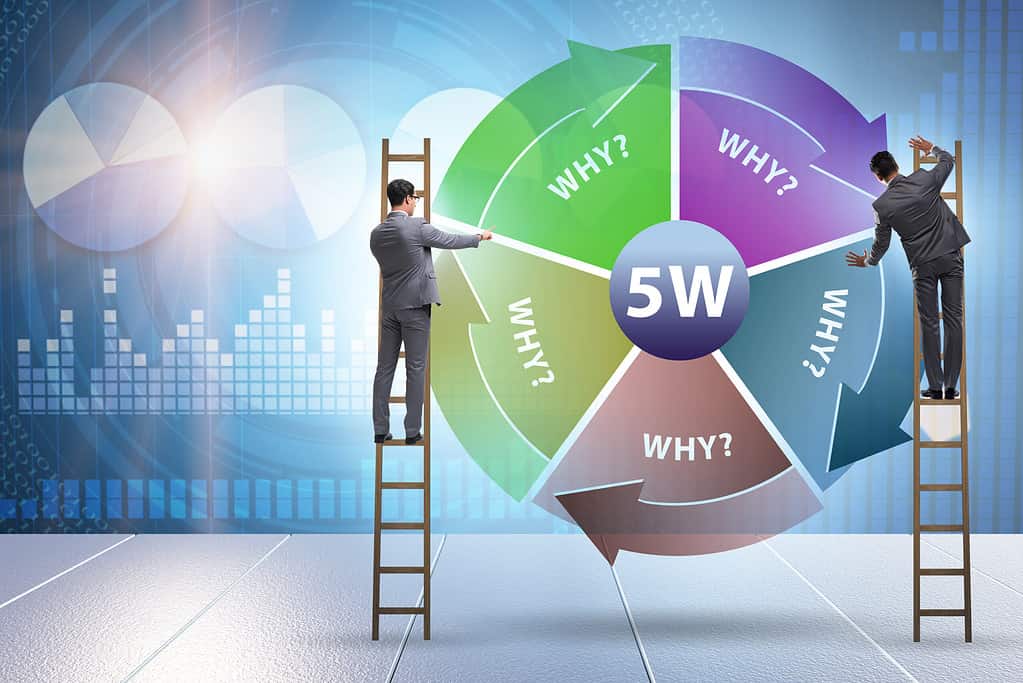
The 5 Whys is a root cause analysis technique that involves asking “Why?” multiple times to uncover the underlying cause of a problem. While not a mapping tool, it’s invaluable for identifying and addressing inefficiencies.
Example:
A retail store suffers from frequent stockouts of popular products. By applying the 5 Whys, the team discovers:
- Why are products out of stock? Orders aren’t placed on time.
- Why aren’t orders placed on time? The inventory system is outdated.
- Why is the system outdated? The team hasn’t prioritized upgrades.
- Why hasn’t it been prioritized? Leadership is unaware of its impact.
- Why are they unaware? There’s no regular reporting mechanism.
The store upgrades its inventory system, reducing stockouts by 70%.
Benefits:
- No specialized tools or training are required.
- Pinpoints specific causes of inefficiencies.
- Inexpensive and fast to implement.
6. Business Process Model and Notation (BPMN)
BPMN is a standardized graphical representation used for modeling complex business processes. It is more sophisticated than process mapping or swimlane diagrams and supports detailed workflows, including conditional logic, decision points, and automated processes. Its granularity makes it one of the better alternatives to value stream mapping for certain use cases.
Example:
A bank uses BPMN to map its loan approval process, identifying points where manual checks slow progress. Automating these steps with a digital workflow reduces approval times from five days to two.
Benefits:
- Universally understood by stakeholders and software tools.
- Suitable for highly complex or automated workflows.
- Provides a granular level of detail for process analysis.
Comparing Alternatives to Value Stream Mapping
While each of these alternatives has its strengths, their effectiveness depends on the specific context and objectives of the organization. Below is a comparison of these alternatives against traditional VSM:
| Alternative | Key Advantage | When to Use | Compared to VSM |
| Process Mapping | Easy to implement | Small, simple processes | Less comprehensive but faster to execute |
| Swimlane Diagrams | Highlights responsibilities | Processes with multiple stakeholders | Adds accountability lacking in basic VSM |
| SIPOC Analysis | High-level focus | Early project stages | Less detailed but great for initial alignment |
| Kanban Boards | Visual and dynamic | Managing work-in-progress | Continuous monitoring instead of static snapshot |
| 5 Whys Analysis | Root cause identification | Diagnosing specific problems | Focuses on “why” instead of “how” |
| BPMN | Detailed and precise | Complex and automated workflows | More granular but requires expertise |
Similar Concepts
Value Stream Maps are a basic tool in Lean Six Sigma. Here are some additional articles on them.
- This article explores the difference between Value Stream Maps and standard Process Maps.
- This next article compares a Value Stream Map with a Spaghetti Diagram.
Final Thoughts
While Value Stream Mapping remains a cornerstone of process improvement, these alternatives offer a variety of approaches to tackle unique challenges. Whether it’s the simplicity of process mapping, the accountability of swimlane diagrams, or the precision of BPMN, each tool has its place in improving efficiency and eliminating waste. Selecting the right tool depends on your organization’s goals, complexity, and resources—ensuring the best outcomes for your improvement initiatives.
The image featured at the top of this post is ©ESB Professional/Shutterstock.com.