It’s natural for a manufacturing group to be concerned with a product’s specification limits – the upper and lower limits imposed on the process. Specification limits are sometimes designated by the producer, definitions of quality or, most frequently, a customer, in an attempt to narrow the distribution of a product’s properties. Unfortunately, to keep a process in control, teams often develop strategies based on those specification limits instead of ones that better reflect the natural variation of that process.
Practitioners should understand that specification limits are something forced upon a process; not part of its natural voice. Knowledge of this concept can help them learn how to develop and follow statistically based control limits as part of a more reasonable process control strategy.
Specifications vs. Statistics
Donald Wheeler introduces this subject in Understanding Industrial Experimentation, Second Ed. (SPC Press, 1992): “The traditional approach to the problem of product variation has been that of specifications. By using specification limits to define some neighborhood of a process’ target, say target ± Δy, manufacturers have hoped to place acceptable bounds upon the degradation in performance for the product. As long as the quality characteristic Y falls within these specification limits, the product is said to be satisfactory. When the value for Y falls outside these limits, the product is suddenly deemed to be unsatisfactory and certain actions are invoked to remedy the situation . . . [However,] specification limits are artificial boundaries used to make arbitrary decisions about what product to use. They are a naïve attempt to deal with the problems created by the variation of product characteristics. All product is considered to be either good or bad, and the dividing line between good stuff and bad stuff is seen to be a sharp cliff.”
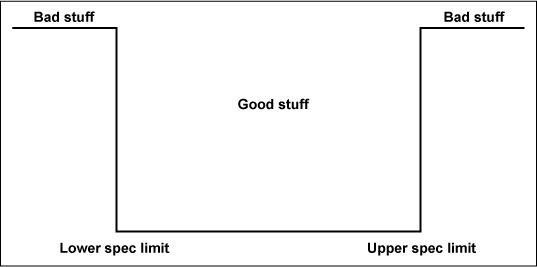
Figure 1 shows how a control strategy based on specification limits works: Good stuff and bad stuff are separated by sometimes arbitrary walls.

Statistical process control based on the voice of the process (i.e., its three-sigma limits) provides a better basis for controlling a process. Under a specification-based process control strategy, if a process’ natural control limits fall within its specifications, an under-control situation can easily arise, wherein the product may drift around its target. On the other hand, if a process’s natural control limits fall outside its specifications, an over-control situation can easily arise, resulting in an inflation of process variation.
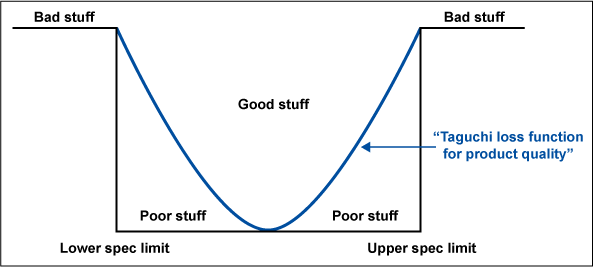
Ideally, what’s needed is a mindset that does not simply consider anything within specifications “good,” but instead continually minimizes variation and strives to center the process using statistically based process rules. Figure 2 shows the results from such a control strategy.

The Taguchi Loss Function helps illustrate the loss in product quality that stems from following specification limits rather than statistically based control limits. The line in Figure 2 is derived from the following:
{σLT2 + (average property – target)2},
where σLT = the process’s long-term sigma.
Notice how this function continually drives a process at its target under conditions of minimum variation. Typically, this function is multiplied by a constant, which turns the loss into estimated dollars used here. The Taguchi Loss Function is an easily calculated, production-run metric that reflects both process variation over the course of the run and the quality of its targeting.
Example: An Under-control Process
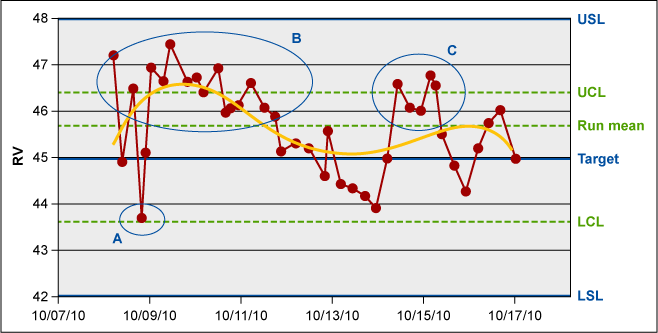
The following example helps show the differences in process management between specification-based and statistically based strategies. Figure 3 is a typical Shewhart chart used for monitoring and controlling the relative viscosity (RV) of a nylon 66 polymer. Generally, the RV measurement system itself is a good one, contributing just 2.5 percent to total process variability. Notice, however, that this polymer’s lower and upper specification limits (LSL and USL) fall well outside its lower and upper control limits (LCL and UCL) – the limits based on this process’s natural voice. Note too, that none of these data points – RV measurements made every 12 hours – fell outside the specification limits.

Production management is usually happy with a run like this, as nothing was produced outside specs. However, depending on their tolerance for variation, the customer might not be happy. Initially, the customer could receive a polymer with an RV well above target (area B in Figure 3), followed by a polymer with an RV well below target, and then again above target (area C). The circled regions in Figure 3 each had data points falling outside the control limits; If the process was being managed statistically, these regions would allow the line engineer to make adjustments to re-target the process. However, the effectiveness of this retargeting would depend on how useful the process’ gain factors were – in other words, how much of an impact an appropriate process adjustment would have on this polymer’s RV.
The capability metrics of the process tell the story. Its Cp, or the voice of the process, is a very capable 1.59, while its Ppk, the voice of the customer, at 0.80, indicates far less practical capability because of the process’ tendency to drift. The combination implies that this process would be judged very capable if 1) the long-term sigma (σLT) – the yellow polynomial fitting line in the chart – could be reduced to short-term sigma (σST), a measure of point-to-point variation and 2) the process targeting were improved.
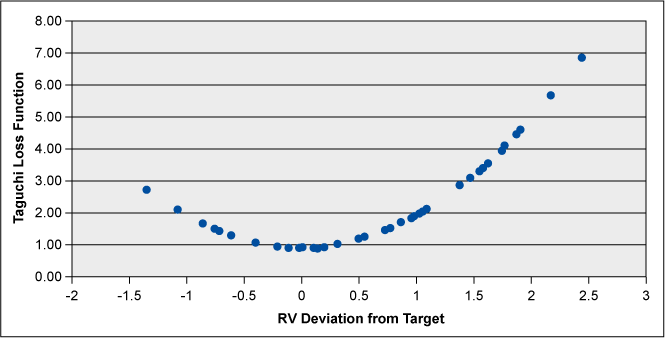
Finally, the quality of the process targeting is evident in the Taguchi Loss Function (Figure 4), which is clearly asymmetrical – it is weighted to the high side of target. Note, this plot is zeroed at the 45 RV target; control limits would sit at +/- 1.4 deviation and specification limits at +/-3 deviation. The perfect run would show a symmetrical “smile shape” bounded by ± 1.4, and its minimum value would fall to σST2.

Improving Performance
A strategy that opts to control a process for violations of its specification limits is never a good thing. When these specs fall well outside natural variation-driven control limits, the process can easily become under-controlled, as evidenced in the RV example above. When these specs fall within the control limits, on the other hand, the process can easily become over-controlled when an operator makes an adjustment that is not called for, given the natural voice of the process. When appropriate adjustments are made, however, the Taguchi Loss Function slides toward its minimum, and the customer’s performance (and satisfaction) likely improves.