Problem solving teams are often confronted with resistance to change. Even if the change is positive, employees are not always willing to embrace the improvements identified through DMAIC projects. However, by involving the employees to solve problems together, instead of providing solutions for them, practitioners can help assure that employees not only buy into process changes, but also fully own the outcome. While such insight is not new, all too often it is not respected because practitioners do not know the best ways to get employees involved. This case study, which follows a project at shipping company TNT Express, offers an example that others, particularly those in a transactional environment, can follow.
Transactional Process Challenges
The invention and sustainable implementation of process improvements requires deep involvement early on from all who will be affected by the change. This calls for transparent teamwork and continuous communication throughout an improvement project. In a transactional environment, however, problem solving efforts can face a peculiar set of difficulties.
Office processes are often characterized by the sparse availability of data. Benchmarking Machine A against Machine B in production is a common practice; doing the same for Worker A and Worker B in an office setting will raise suspicion and can even run against labor laws. Often, office workers are more exposed to internal and external regulations – everything from legal requirements to company politics. These workers also may encounter discontinuous processes; think of activities such as monthly planning or closing, daily reporting and so on, all of which are often done on top of a continuous influx of other work. The resulting complexity leads to difficulties for problem solving teams to “invent” and sustainably implement an improved process design. The only solution is to engage all stakeholders (people concerned with the planned change) during the entire improvement activity.
Speeding Up Data Entry
The transactional process improvement project described here was completed at a major distribution depot operated by TNT Express. Each truck arriving at the depot completes a debriefing process, in which the driver delivers to the office a folder filled with data. That data is then entered into the computer system. The data-entry process needs to be quick and highly reliable so that the sorting and loading of shipments can be fast and defect-free. This project focused on reducing the time it takes to complete each debriefing in order to reduce stress and resulting defects in shipment sorting and loading, as well as to reduce the time drivers are required to stay in the depot.
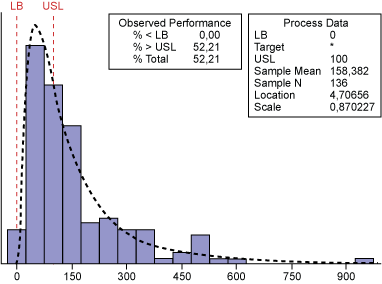
For reasons of confidentiality, the original process data is not presented here; instead, process lead times are measured in normalized “time units.” Figure 1 displays the current process capability: about 50 percent of the debriefing and data-entry activities are handled in excess of 100 time units. For subsequent processes to function without disruption, this rate can be no higher than 20 percent.

Improving the poor capability of this process has been tried several times in the past. Each time, the focus was to set targets for employees and implement reward-and-punish systems for compliance. However, a higher process performance could never be sustained. This history created the perception among employees that process improvements are possible only by working people even harder.
Given this context, the project team set high standards for execution and communication. Their goal was not only to see people accept a new and better process, but also to make them enthusiastic participants in understanding the current process and developing an improved process design.
Carefully Planned Communication
A carefully prepared communication plan can be an invaluable instrument. To create their plan, the team identified all project stakeholders and assessed their influence and how favorable they were to the project. This allowed the team to tailor their communication plan to the specific context. They also included a metric to measure communication success. This type of metric can be as simple as counting the number of “thumbs up” given by participants after an all-hands department meeting.
At one occasion, lack of communication spelled serious risk for the project’s success. The team had planned to conduct intensive data collection. When six team members arrived at the depot, all equipped with notebooks and stopwatches, they discovered that the office employees had not been informed about their activities and intentions. The person in charge of that communication had simply forgotten his task, which had been designated to him in the communication plan. People don’t enjoy being measured with stopwatches without being given a decent explanation why. Because the project was led by a trusted work-council representative, an improvised informational session saved the day. However, the team learned a powerful lesson about the importance of sticking to the communication plan.
A Strong Kickoff
The project team knew that German TNT employees tend to be hands-on and pragmatic people; rather than beating around the bush, they want a crisp description of the problem, and then they want to move on and solve it. Therefore, the team thought a 30-minute kickoff meeting would be appropriate, with the sponsor briefly introducing Lean Six Sigma as the chosen approach for problem solving. Then the project leader presented the Define tollgate, the content of which had previously been established in collaboration with some of the depot employees. The goal was to prepare a highly consensual kick-off meeting with no surprises.
At the end of this meeting, the project sponsor left and the employees stayed to complete a process mapping exercise with the Lean Six Sigma team. As a warm-up, the team asked the employees to map out the process of making a cup of coffee. Even in this seemingly simple exercise, people had difficulties distinguishing between process steps and the multiple activities inside each step. As a result, their process map displayed chaos and complexity, not structure or logical flow. This experience helped them to understand that even if each team member does their individual work tasks well, the end result can still be poorly structured when all the activities are viewed together.
In a separate session, the team and the depot employees brainstormed reasons why data entry times vary. Employees were given a number of votes to distribute among all possible reasons named. The team then explained how they would use data to establish how the factors with the most votes contributed to the problem. A quick round of gathering participants’ feedback showed that they were happy about a good start.
Discovery Through Data
The team found that one supposed main culprit for the problem of long process times was manpower levels. Employees were convinced that data entry took longer simply because the depot did not have enough staff on hand to help out. The team clarified that they would validate this statement through historic process data, collected shift by shift for as many days as possible. The team would then plot the hours worked in the data entry process against the percentage of events lasting longer than 100 time units. Employees were sure about the outcome: “We will find a downward tendency: More people leads to fewer problems!”
The team, however, did not find such correlation in historic data. This counterintuitive insight made employees realize that data entry times were not solely dependent on the number of people working and that they needed to look at the other potential reasons identified. This experience helped secure support for, and involvement in, a more extended round of data collection. It also established data analysis as the sole judge to better understand the mechanics of the process.
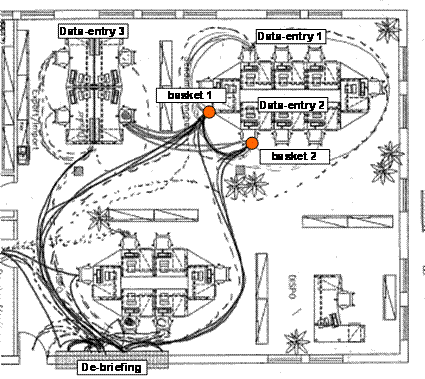
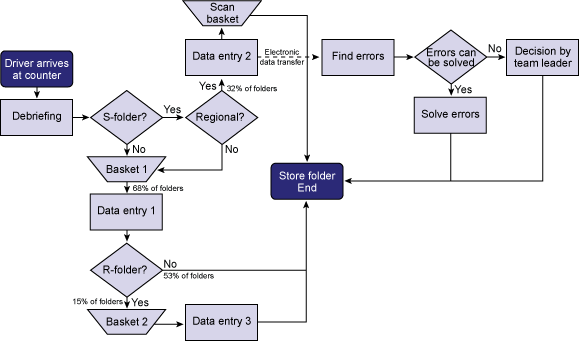
When the team had first visited the depot and seen the process of debriefing and data entry, they were puzzled by some actions. Employees dropped folders in baskets and others picked them up, but in this hectic environment they did not talk much to each other. The team decided to visualize folder transport and the motion of people in the process, and link that to the detailed flow of activities in a spaghetti chart (Figure 2). Transportation and motion are two of the seven wastes revealed in a Lean analysis. The actual process steps are detailed in Figure 3.


Note: For reasons of confidentiality, this diagram shows generic decision and activity titles.
To collect measurements, the team instigated a plan to use time stamps on folders at the start and finish of each process step. Employees at the debriefing desk, the two baskets, and data entry stations 1, 2 and 3 were equipped with synchronized stopwatches. Whenever a folder arrived at a station, these people wrote down the folder name and its start and finish times. It was after this preparation that the team went into the office to start measuring – only to find out, as mentioned earlier, that employees had not been informed about their arrival, which necessitated an improvised informational session.
All resulting data was then put together in one spreadsheet (Table 1). The next day, these results were shown to all office employees. While reviewing the data, employees could easily see the long wait times in the baskets (67 time units on average); however, the overall goal of this meeting was to collect empowerment for further data analysis.
Table 1: Task and Waiting Time and Workload
| Truck | Debriefing | Basket 1 Times | Basket 2 Times | Data Entry 1 | Data Entry 2 | |||
| Time | No. of connotes | Time | No. of connotes | Time | No. of connotes | |||
| 1 | 42.7 | 65 | 15.6 | 82.3 | 50 | 5.0 | 15 | |
| 2 | 23.0 | 69.4 | 0.9 | 1 | ||||
| 3 | 46.7 | 12 | 0.6 | 23.1 | 8 | 36.7 | 4 | |
| 4 | 33.3 | 62 | 5.3 | 10.4 | 21.6 | 13 | 35.7 | 43 |
| 5 | 64.9 | 1.2 | 2 | |||||
| 6 | ||||||||
| 7 | ||||||||
| 8 | 41.6 | 5 | 5.4 | 22.6 | 5 | |||
| 9 | ||||||||
| 10 | 31.7 | 45 | 21.0 | 13.7 | 65.7 | 27 | 51.1 | 17 |
| 11 | 26.7 | 47 | 7.4 | 11.3 | 61.3 | 22 | 6.1 | 15 |
| 12 | 20.0 | 13 | 3.6 | 13 | ||||
| 13 | ||||||||
| 14 | 1.7 | 6 | ||||||
| 15 | ||||||||
| 16 | 47.9 | 21 | 3.3 | 73.9 | 8.8 | 8 | 3.2 | 7 |
| 17 | 54.0 | 39 | 1.4 | 1.7 | 66.4 | 19 | 9.7 | 18 |
| 18 | 29.1 | 17 | 1.8 | 20.7 | 36.6 | 12 | 1.0 | 4 |
| 19 | 118.0 | |||||||
| 20 | 10.2 | 89.9 | 8.3 | 7 | 2.4 | 2 | ||
| 21 | 25.8 | 15 | 3.6 | 68.4 | 22.3 | 6 | 96.3 | 7 |
| 22 | 112.6 | |||||||
| 23 | 47.1 | 4 | 3.9 | 99.4 | 14.1 | 1 | 3.6 | 2 |
| 24 | 20.0 | 15 | 1.7 | 39.0 | 40.8 | 7 | 59.2 | 3 |
| 25 | ||||||||
| 26 | 48.0 | 44 | 59.3 | 8.2 | 71.4 | 42 | ||
| 27 | ||||||||
| 28 | 17.3 | 33 | 2.2 | 45.1 | 6 | 31.7 | 27 | |
| 29 | 16.8 | 52.8 | 19.0 | 11 | 5.1 | 20 | ||
| 30 | 20.0 | 18 | 6.3 | 0.1 | 28.6 | 8 | 30.4 | 8 |
| 31 | ||||||||
| 32 | ||||||||
| 33 | ||||||||
| 34 | 18.1 | 4 | 11.2 | 107.7 | 17.1 | 1 | 0.9 | 2 |
| 35 | 69.4 | |||||||
| 36 | 20.9 | 19 | 61.1 | 67.3 | 9 | 6.4 | 10 | |
| Averages | Averages | Averages | Averages | |||||
| 32.8 | 27 | 13.1 | 54.3 | 38.9 | 14 | 18.8 | 11 | |
Taking Advantage of Multipliers
Batch-size reduction is an important Lean tool for reducing process lead times. In this case, the batch is a folder, and its size is the number of documents it contains, called connotes in the logistics industry. To assess the impact of the batch size on the duration of each process step, the team used regression analysis. Because they felt batch size reduction could spell a process redesign, they wanted the results of this analysis to be well-communicated. In the environment under which the project operated, the team also thought it would be best to use informal communication channels. Therefore, they invited strong communicators for a meeting to perform and interpret the data analysis together.
Most of these strong communicators were not familiar with regression analysis. For that reason, the team first developed scatterplots on flipcharts, had people plot x-y pairs of data and draw eyeball fits as regression lines. The employees soon noticed that more connotes led to longer process times.
The team also made sure that people understood the meaning of the regression coefficient, R2. For the data from debriefing and data entry station 2, variation in the number of connotes explained only 4 percent and 3 percent, respectively, of the variation observed in process times, while this rate was as high as 60 percent for data entry station 1. In other words, for debriefing and data entry station 2, the average times were 32 and 19 time units, respectively, no matter the size of the folder (this over the range of observed folder sizes). On the other hand, data entry stations 1 and 3 took, on average, 19 and 16 time units for each folder and an additional 1.4 and 4 time units per connote inside the folder. This result surprised people – but they were also able to make sense out of it. The employees knew that:
- Debriefing a driver mainly meant sorting the paperwork in a folder, an exercise that also allowed for consistency checks of the documents; variation in process time depended far more on the driver’s pre-sorting than on the number of connotes.
- Data entry station 2 involved automatic work started by an employee, so there was no surprise to see it independent from the number of connotes.
- Data entry stations 1 and 3 involved manual work per each document.
In the resulting discussion, employees drew conclusions such as, “We need to make sure drivers arrive with their documents sorted already” and “At each work station, we need to find ways to reduce the amount of work it takes to handle a folder; then people can focus on handling the connotes inside the folder.” Another conclusion was much harder so see: The process takes 100 time units, on average, but it can ideally be performed in as few as 5 time units without people working faster on individual documents. This is the raw process time it takes to handle a single document along process steps 1 and 3 (1.4, plus 4 time units). In batch-processing, while one connote in a batch is being worked on, all others sit “waiting.” The ideal process is a single connote process, not a batch process. With that said, Lean experts should not forget that this discovery can take time to sink in for employees who are unfamiliar with the concept.
At the end of this half-day analysis session, the team summarized the ideal process:
- Debrief a driver and split the folder into individual connotes
- Enter the data along the original process steps
- Physically locate the process steps closely to each other (to avoid the waste transportation of 10 time units and the waste of waiting in the baskets of 67 time units)
- Distribute workload through a visual (kanban) control system of inventory between multi-skilled workers in data entry types 1, 2 and 3.
Developing a New Process
The next day, the team went to the office and presented the results of the analysis. Thanks to the informal information channel within the company, the key items were made known to the rest of the employees. Enthusiasm for a great analysis had given way to all kinds of concerns, such as, “If we all need to sit together, we will not have our individual desks any more.” Also, those at data entry station 1 did not want to give up their privileged seating from where they could oversee the entire office. Desks and work places could not easily be shifted around because computer and electricity cables were bound to certain locations – and so on.
Even so, during the meeting the team was able to set up a process prototype, which people accepted as an interim solution. Despite employees’ initial hesitancy, this prototype was a great success, without even touching the issue of folder size. Simply by having people sit together and have a visual kanban system for the folders (to control inventory of folders in the process), the process was now operating with only 20 percent of the folders with lead times of more than 100 time units.
However, because of the timing system implemented in the Measure phase to track daily lead time performance, the employees knew that the solution was not yet good enough and kept working on lifting the other potentials of the solution. The employees were allowed to continue developing their own solution at their own pace, knowing that management trusted them to get their problems sorted out.
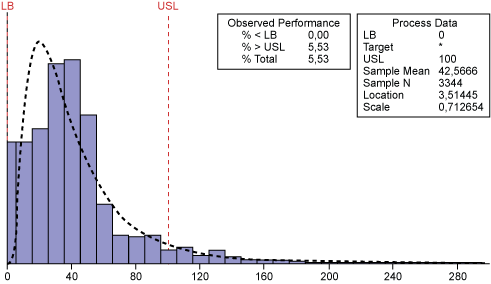
It took more than a month to fully close the project. While that is far from the Lean ideal of getting things done quickly, there may be occasions to give employees time to adjust to changes so that the improvements ultimately have a better chance of survival. Figure 4 shows the process capability for the process well after project finalization. Only about 6 percent of the cycle times are more than 100 time units.

Working as a Group
What is often described as resistance to change may in fact be resistance to a specific improvement approach. Recognizing this concept can keep success under the control of the improvement team. When teams communicate carefully and in a planned way during the project and keep stakeholders engaged with all of the tools that are being used, including analysis, they can increase dramatically the likelihood of formulating and implementing a lasting solution.