All over the world, industries are feeling a double pinch from the economic downturn and increased energy prices. Now is the time to introduce cost-saving measures – including increasing operational efficiency.
To increase plant efficiency, organizations should focus both on broader as well as detailed factors. One way to manage the improvement process is by following the 5V approach, which includes popular Lean Six Sigma concepts. The 5Vs (voice of the customer, value addition, value stream mapping, variation zero and visual management) start with a broader perspective and carry on with a narrower focus on continual improvement and better control measures.
1. Voice of Customer
Voice of customer (VOC) helps to determine the function-cost relationship of a product. It also helps to better understand the need of the customer. VOC can be obtained through many sources, including:
- Surveys
- Online feedback
- Quality function deployment (QFD) analysis
But to improve plant efficiency, it is important for organizations to examine not only the voice of customer who is buying their product, but also the next succeeding process or department.
For example: By collecting VOC, a company determined there was a demand for producing 10 mobile sets per month with certain specific features. This helped set the takt time at which the product should be manufactured at 5 seconds for an assembly line. To meet this production rate the company took the voice of all departments to see what would be needed to achieve this pace. Their concerns included the limitation of the machines, manpower requirements and proper resource planning. The company took these issues into consideration, and incorporated feedback and suggestions from the workers into their plan for achieving the production rate.
2. Value Addition
How do you define value? The answer can differ from person to person. Some common responses are:
- Value is a relative term.
- Value is not price or cost of the product.
- Value can be functional, social and aesthetic.
Numerically, value = function/cost.
To understand this concept, consider this example: Company A is in the mobile phone manufacturing business. The cost of a mobile phone is $50. The phones have features such as an FM radio, a flashlight and 10 hours of talk time. To increase the phone’s value, the company has several options:
- Keep the same functions, but lower the phone’s cost.
- Add more functions, such as Bluetooth or a better overall appearance, but keep the cost the same.
- Add more functions and lower the cost.
Similarly, value can also be increased in a plant. This can be done by first dividing the plant’s activities into value added (VA) and non value added (NVA) categories. VA activities are those for which customers are paying the company; all other activities are waste or NVA.
For example, fixing a table top with screws follows this process:
- Bring the table top to the work area
- Place it on top of the table legs
- Take the screw
- Fix it on screwdriver
- Fix the screw on table and drill it into the table
In this process, only the Activity 5 is VA because that is when the actual work is being done.
Therefore, to increase the efficiency of the plant, the percentage of NVA activities must be reduced, thus increasing the VA activity ratio. To decrease NVA activities, plant managers should look for the seven typical types of waste, which can be remembered with the acronym TIM WOOD:
- Transportation
- Inventory
- Motion
- Waiting
- Overproduction
- Overprocessing
- Defect
3. Value Stream Mapping
Value stream mapping is used to create a map of material and information flow in a product or process. Creating the map involves two steps. It starts with a current state map, which shows how the process is operating. Then, an organization plans for improvements using a future state map, which shows where the process is going and how it will get there. The value stream map can be used to streamline work processes, thereby cutting lead times, increasing efficiency and reducing operating costs.
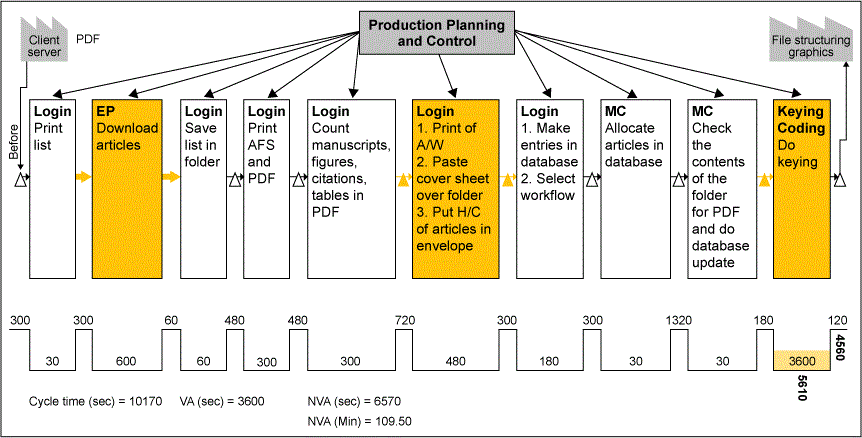
Case Study: Consider a process for an e-publishing company whose business is type-setting the articles for journals and research papers. The company started by mapping its present state value stream (Figure 1).

The map includes the various steps in the type-setting process and their cycle time, including time taken for transportation, storage or delays. For this process, the VA time is the time when actual key coding is done. The total process time was 10,170 seconds. Because the VA time was only 3,600 seconds, the total NVA time was 6,570 seconds.
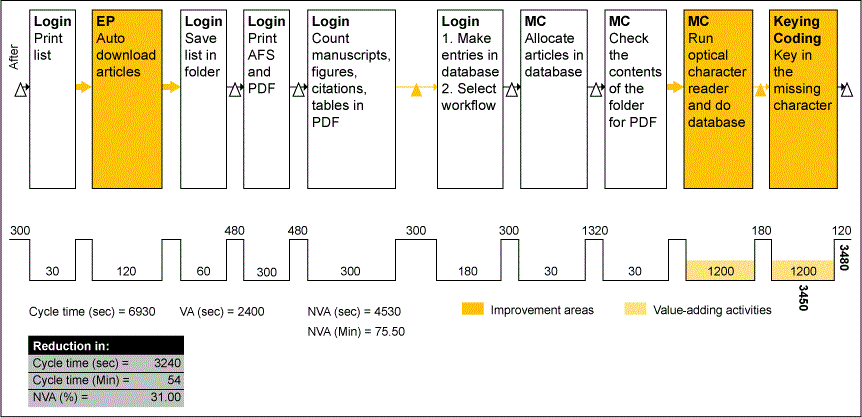
When mapping the future value stream, the company marked the areas that were under consideration for improvement in orange. These steps were eventually eliminated because the activities, such as printing, are not required (printing can be avoided because electronic copies can serve the same purpose). Also, the company divided key coding into two activities and developed a program to run an optical character reader. This new process (Figure 2) reduced cycle time and turnaround time.

4. Variation Zero
Manufacturing one defective product is equal to the loss of three defect-free products. Defects arise from various, source, including:
- Incoming material quality not meeting the specified standards
- Machines wearing out
- Variation in the skill levels of workers
These problems all cause variations in a process. Variation can occur due to natural causes or assignable causes. Six Sigma can help keep these variations in check by continuously monitoring processes in control charts. Recording and using work instructions and standard operating procedure manuals (including pictures) also can help reduce variation. Poka-yoke or mistake proofing systems can be applied as well to prevent defects from occuring.
For example: A machine used in an assembly line has a standard picture of the product. As soon as the product comes below the machine’s camera, the machine automatically compares the product picture with the standard picture. If some abnormality is found, the machine will give an alarm and stop functioning.
5. Visual Management
The last “V” stands for visual management. Visual management means the entire production system is controlled visually. This concept includes implementing better housekeeping by following 5S (sort, shine, . Organizing a plant using 5S helps provide a healthy work environment for operators and increases efficiency. An untidy environment degrades not only the quality of goods produced, but also the motivation level of the employees working there.
For example: One company uses a production monitoring software system that displays everywhere on the shop floor. This way, everyone working can get to know the status of all the assembly lines. The software shows defect levels, as well as the targets managers wish to achieve and the actual production rates, so that operators are aware of when they are behind. Quality professionals can use the data to work toward solutions that will help decrease defects and delays in the future.