
You take samples to estimate and describe something about your population. You will use that information to make decisions about your process. That’s why it’s important to have estimates that are unbiased and represent the true underlying population.
We will explore the concept of bias and learn how to calculate unbiased statistics so you have good estimates of your population.
Overview: What is an unbiased statistic?
In statistics, a descriptor of the population is called a population parameter. Since it’s often impractical or impossible to measure everything in a population, you use samples. The descriptors of the sampling distribution are called sample statistics. The intent is to use the sample statistics to tell you something about the population parameters.
Sample statistics should accurately estimate the population parameters. Said another way, you want your sample information to be an unbiased statistic or estimator of the population parameter. A biased statistic would be a unidirectional difference between your sample statistic and actual population parameter. An unbiased statistic would be expected to have a difference of zero over time.
The topic of a biased versus unbiased statistic is most commonly discussed when calculating the variance or standard deviation of the population. The formula for the population variance is:
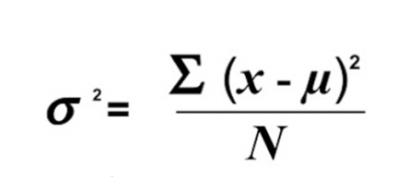
Since you never know the true value of mu, you would have to use Xbar, the unbiased statistic for mu.
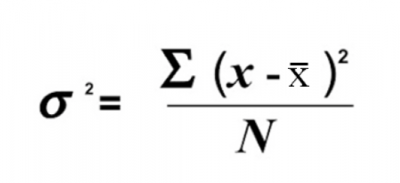
If you are using the sample statistic, Xbar, you should use a sample statistic of variance to estimate the population variance. The formula for that is:
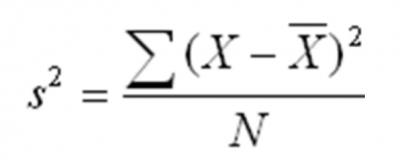
But, since we are referring to a sample, you need to use n instead of N for the sample size.
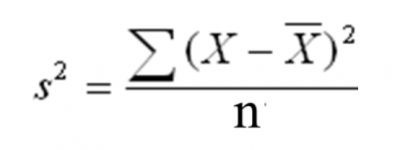
The problem is this is a biased statistic and will underestimate the population variance. It is beyond the scope of this article to show the derivation of why this is true.
Maybe a conceptual explanation will help clarify this. Assume you have a normal distribution, as shown below.
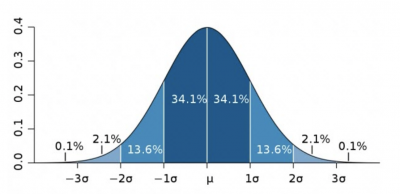
Image source: Normal Distribution
If you were to draw samples from this distribution, you would have a higher probability of drawing your samples within the range of +/- 1 standard deviations around the mean since over 68% of the data is located within that range. You would only have a small probability of selecting a sample farther out in the tails.
If you used the formula for population variance above, you would include all the data in your calculation. But, the variance of your samples would be lower since the range of your sample values would cluster more in the middle. This would be a biased statistic since it would always underestimate the population variance.
So, what can you do to increase the value of the sample variance to make it an unbiased statistic?
Bessel’s correction uses n − 1 instead of n in the formula for the sample variance. This corrects for the bias and now represents an unbiased statistic for estimating the population variance.
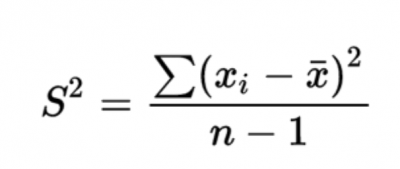
Why n-1 and not n-2 or n-3? With those values in the denominator of the formula, the resulting calculation for variance will get larger as the denominator gets smaller. While just using n will give you an underestimate, using n-2 or more will result in an overestimate and a biased statistic. Using n-1 provides the best unbiased statistic and estimate of the population.
The screenshot below is from a simulation.
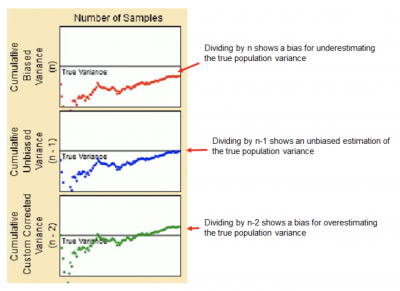
Image source: Dividing by n, n-1 and n-2
Note that the impact of n-1 versus n decreases as the sample size increases. If you had a sample size of 3, dividing by 3 or 2 (n-1) is a significant difference. But if your sample size was 100, then dividing by 100 or 99 won’t show much of a difference.
3 benefits of an unbiased statistic
You use sample statistics to estimate population parameters. Having an unbiased statistic will provide you with the most accurate estimate.
1. Best estimate
For example, using n-1 in the denominator for calculating sample variance will provide you with the best estimate of the population variance.
2. Minimizes bias
Over- or underestimating your population characteristics will lead you to a biased estimation. Using an unbiased statistic minimizes or possibly eliminates the bias and error associated with sampling.
3. Broad application
While most discussions about an unbiased statistic revolve around estimating the mean and variance of a continuous population distribution, it can be used for other distributions as well.
Why is an unbiased statistic important to understand?
Any bias in your estimations of population parameters will have a negative impact on any conclusions or assumptions you make about your process data.
Difference between biased and unbiased statistics
Don’t just blindly use a formula without an understanding of whether it will provide a biased or unbiased estimate of your population.
What is your statistical software doing?
For example, in Excel you can use commands for calculating statistics or parameters. You will want to understand the proper formula to use depending on what you want to know about your data.
Variance versus standard deviation
Our discussion above has focused on the unbiased statistic of variance rather than standard deviation. While the sample statistic for variance using n-1 in the denominator is an unbiased statistic, the square root of the variance (standard deviation) is a biased statistic for the population standard deviation. This is why variance is used for mathematical calculations and not the standard deviation.
An industry example of an unbiased statistic
Jerry was in charge of sampling unshipped jars of peanut butter in the warehouse. One of the critical product characteristics was spreadability. This was tested by dropping a pointed weight and measuring the height of the splash of peanut butter. Once a jar was sampled, it could not be shipped to the customer. Jerry wanted to minimize the number of sample jars yet wanted to estimate the population characteristic for all the other jars in the warehouse.
There were specifications for the average splash allowed as well as the variation of splash as measured by the variance. The true average splash of the 150,000 jars in the warehouse was unknown, as was the variance.
Jerry sampled 50 jars and performed the spreadability test. He calculated the mean splash to be 1.17 inches. Since the value was within spec, he was comfortable this was an unbiased statistic and represented the true average of the remaining jars.
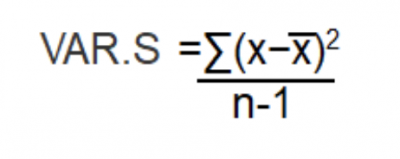
Since he was using Excel to do his calculations, the command =VAR.S(D2:D51) was used to compute the unbiased statistic for the sample variance. The formula for VAR.S is:
3 best practices when thinking about an unbiased statistic
Calculations for sample statistics and population parameters are generally done with the use of statistical software. Think about the concept in a broader context.
1. Confirm the validity of your measurement system
Statistical calculations are easy to do, but do you trust the data? Before doing any calculations, perform a measurement system analysis (MSA) to confirm that your measurement system is giving you consistent and accurate data.
2. Select the appropriate sample size
In our discussions above, you saw the impact sample size can have on your calculations. Determine the appropriate sample size prior to collecting data and calculating your sample statistics.
3. Use software to do your calculations
While it might be interesting to do your calculations by hand one time to better understand your formula, there is no need to spend the time and effort to always do it by hand. If you are using Excel or another software application, be sure you understand the underlying calculations the program is using.
Frequently Asked Questions (FAQ) about an unbiased statistic
Is the sample median an unbiased statistic for the population median?
Yes, if the population distribution is normally distributed or symmetrical.
Are sample ranges unbiased statistics?
No, the sample range is always smaller than the true population range. The population range is the range of all the values in the distribution. It is unlikely that your samples will include the extreme values of your population data, so the sample range will be a biased statistic of the population parameter.
Why is an unbiased statistic better than a biased statistic?
An unbiased statistic provides a more accurate estimate of the population parameter. A biased statistic will either under- or overestimate the population parameter.
Final thoughts on unbiased statistics
You should resign yourself to using samples rather than capturing all the data in your population. Use your sample statistics to make inferences and estimates of your population parameters. If your goal is an accurate estimate of the population, use an unbiased statistic to accomplish that.