Key Points
- SIPOC is a process map used for visualizing and defining a process.
- It is a high-level visualization tool, so it works best when used early in the process planning stages.
- It is a flexible means of visualizing your processes, capable of adjusting to scale with ease.
SIPOC is a high-level process map of your extended process. Let’s explore what SIPOC is, how to make one, and look at an example.
What Is SIPOC?
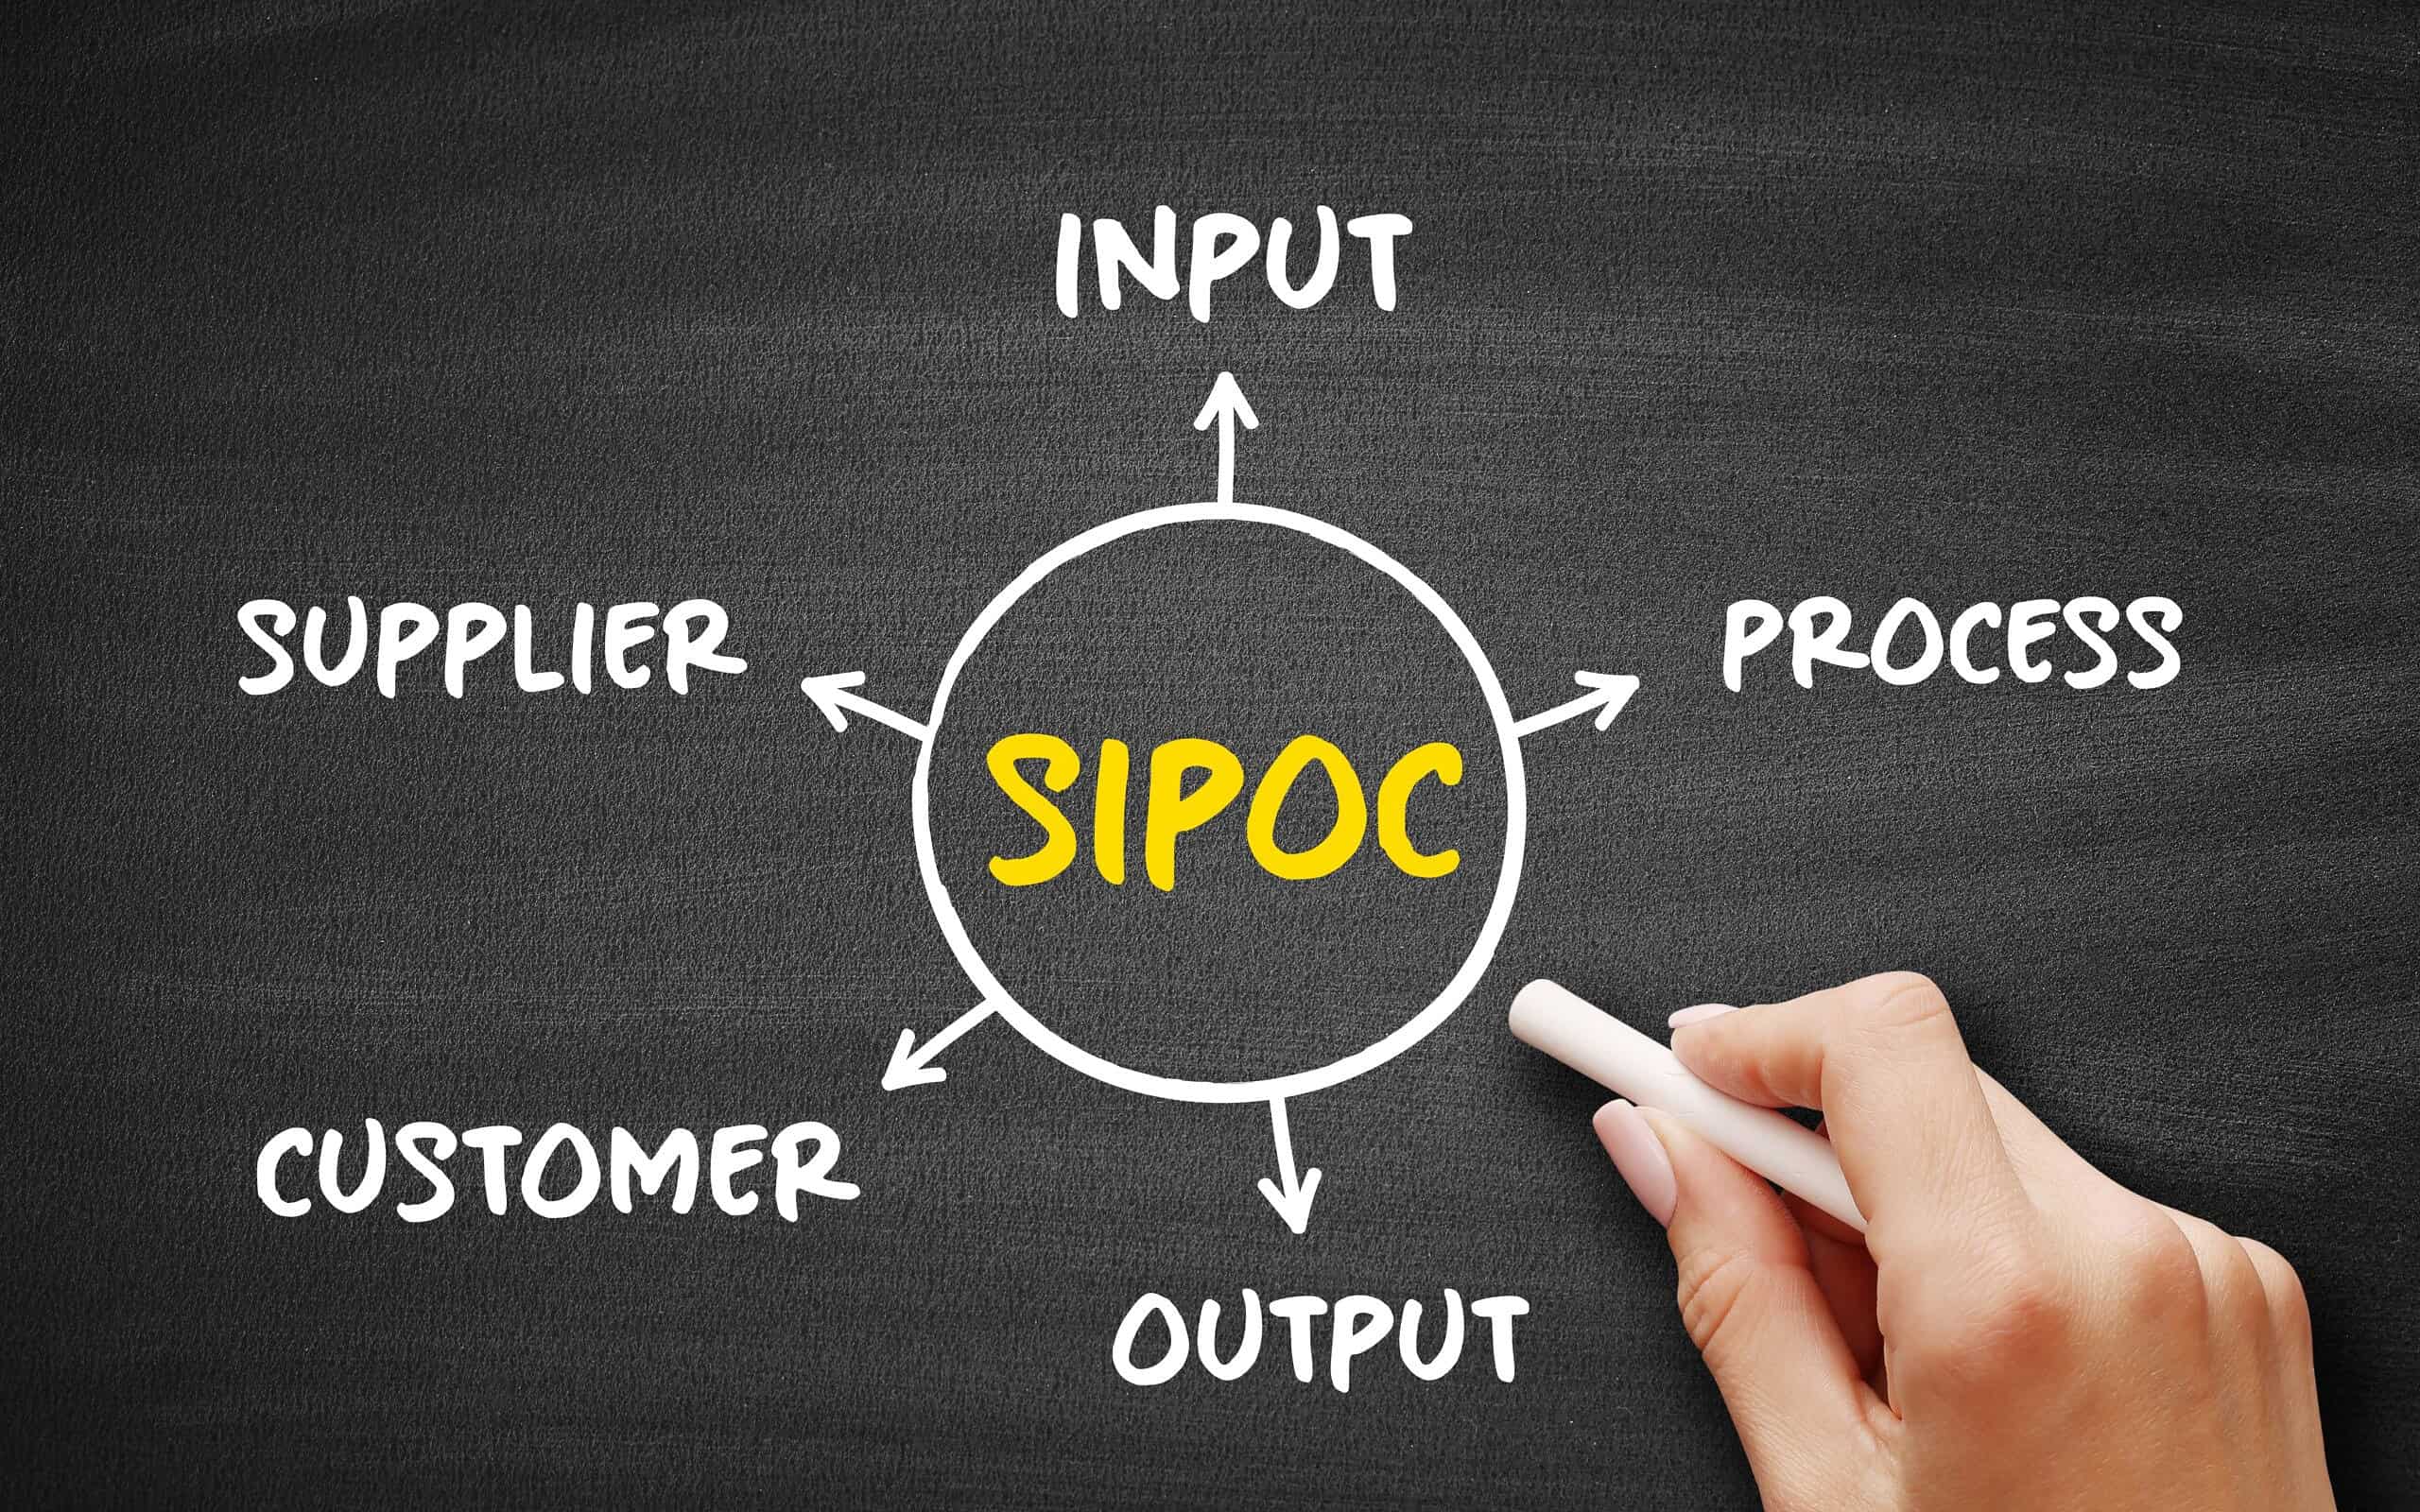
SIPOC is used in the Six Sigma DMAIC methodology, usually in the Define stage. The letters of SIPOC stand for supplier, input, process, output, and customer. Here is how you would draw this process map.
The first step would be to define and scope the process you wish to map. This can be done by having a definable start and stop for the process you are analyzing. Your scope can be narrow or wide depending on whether you’re looking at a high- or low-level process.
Here’s the sequence to follow:
- Suppliers: This is where your inputs come from. These suppliers may be internal or external.
- Inputs: These would refer to such things as people, materials, equipment, procedures, money, utilities, environmental conditions, data, and anything else your process needs to function.
- Process: Your SIPOC should describe your process in 5-7 high-level steps.
- Output: Next, identify the outputs of your process steps. These could be such things as products, services, or information. Your outputs could be good or bad such as scrap, defects, or pollution.
- Customer: This would be the person or organization who receives your outputs. It could be the next functional area in your organization or the actual external customer. All of your outputs go to some customer, somewhere, who has expectations and requirements for your output.
- CTQs (Critical to Quality) or requirements: These are the key metrics you will want to track for the inputs from your suppliers, process performance, and output going to your customers. It is optional whether you include them on your SIPOC, but be sure to capture these somewhere.
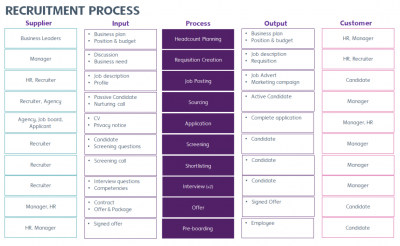
Here is a graphic showing an SIPOC for an HR recruiting process:

Why It Matters
Having the means to visualize your processes can be instrumental in getting your team on the same page. While SIPOC isn’t as flexible or in-depth as certain tools, that is one of its strengths. You reserve the specialized tools for the teams that need them, while SIPOC acts as a broad view of how the process will be structured.
An Industry Example of SIPOC
The director of operations for a large gas company wanted to improve the process for customer payments. A Six Sigma consulting firm was hired to help his staff develop process maps for all his functions.
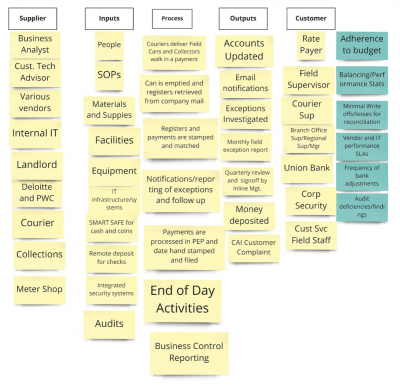
One of the key ones was for the collection of payments from their network of collection locations in the field. Here is what their SIPOC looked like using an online collaborative application. The format simulated the use of sticky notes. The blue ones represent some of the key metrics they wished to monitor.

Other Useful Tools and Concepts
Looking to bolster your business? You might want to learn about center points. These mathematical centers are a great way of seeing if your data has a linear relationship when conducting a DOE.
Further, you might do well to learn how to implement the Bartlett Test in your statistical analysis. This is similar in concept to other 1-way ANOVA, but with some key differences, you’ll want to take note of.