Key Points
- Non-parametric tests are used when standard assumptions are not available.
- These tests don’t rely on distributions, often using real-world data instead.
- These tests are simple to implement, allowing laypeople to conduct them if needed.
Many statistical tests have underlying assumptions about the population data. But, what happens if you violate those assumptions? This is when you might need to use a non-parametric test to answer your statistical question.
Non-parametric refers to a type of statistical analysis that does not make any assumptions about the underlying probability distribution or population parameters of the data being analyzed. In contrast, parametric analysis assumes that the data is drawn from a particular distribution, such as a normal distribution, and estimates parameters, such as the mean and variance, based on the sample data.
Overview: What Is Non-Parametric?

Non-parametric methods are often used when the assumptions of parametric methods are not met or when the data is not normally distributed. Non-parametric methods can be used to test hypotheses, estimate parameters, and perform regression analysis.
Examples of these methods include the Wilcoxon rank-sum test, the Kruskal-Wallis test, and the Mann-Whitney U test. These tests do not assume any specific distribution of the data and are often used when the data is skewed, has outliers, or is not normally distributed.
Be aware that a test like Mann-Whitney will have an equivalent parametric test such as the 2-sample t-test. While the t-test compares two population means, the Mann-Whitney will be comparing two population medians.
5 Benefits of Non-Parametric
There are several benefits to using non-parametric methods:
1. Distribution-free
These methods do not require any assumptions about the underlying probability distribution of the data. This means you can use any type of data, including data that is not normally distributed or has outliers.
2. Robustness
Non-parametric methods are often more robust to outliers and extreme values than parametric methods. They can provide more accurate results in the presence of such data points.
3. Flexibility
These methods are very flexible and can be used to analyze a wide range of data types, including ordinal and nominal data.
4. Simplicity
Non-parametric methods are often simpler and easier to use than parametric methods. They do not require advanced mathematical knowledge or complex software.
5. Small Sample Sizes
Such methods can be used with small sample sizes, as they do not require large sample sizes to provide accurate results.
Getting Results That Work
Your data isn’t going to be perfect, and that’s alright. These testing methods are made for real-world data, points that don’t fit into any sort of standard box. Since the calculations themselves are so easy to conduct, you can assign them to members of your team who might not be well-versed in statistical analysis.
Further, these tests work right alongside the more rigorous statistical test you’ll run through the course of your analysis. As such, they are vital to understanding what’s happening with your production.
Why Is Non-Parametric Important to Understand?
Understanding non-parametric methods is important for several reasons:
Real-world Data
Real-world data often does not meet the assumptions of parametric methods. Non-parametric methods can be used to analyze such data accurately.
Complementary
Non-parametric methods can complement parametric methods. By understanding non-parametric methods, you can use the appropriate method for their data type and ensure accurate results.
Flexibility
Non-parametric methods provide a flexible set of tools that can be used to analyze a wide range of data types, including data that is not normally distributed or has outliers.
An Industry Example
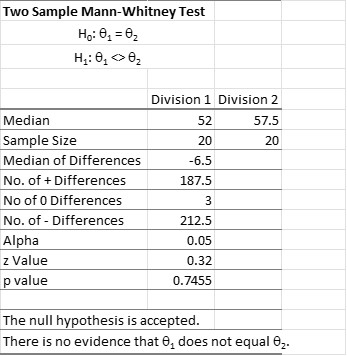
A sales manager for a consumer products company wanted to compare the sales of two sales divisions. When she tested the data for normality, she found the data from both divisions was not normally distributed. The company’s Six Sigma Master Black Belt recommended she use a Mann-Whitney test to determine if there was any statistically significant difference between the two groups. Below is the output of the data she ran. Note, that while there is a mathematical difference between median sales, it is not statistically significant using the Mann-Whitney test.

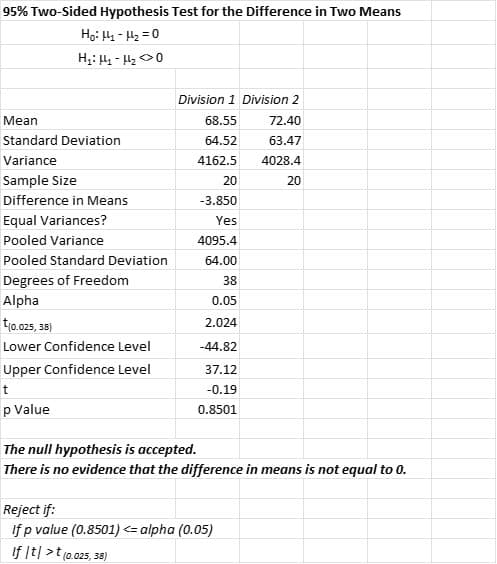
Interestingly, the use of the parametric 2-sample t-test results in the same conclusions despite the violation of the assumption of normality. That could be due to the robustness of that assumption.

7 Best Practices
Here are some best practices for using these methods:
1. Understand the Data
Before applying non-parametric methods, it is important to understand the characteristics of the data. This includes assessing the distribution of the data, identifying outliers, and considering the scale of measurement (nominal, ordinal, or interval).
2. Choose the Appropriate Test
There are many different tests available, each with different assumptions and requirements. It is important to choose the appropriate test for the research question and data type.
3. Use Multiple Tests
Using multiple non-parametric tests can provide you with more robust results and help validate findings. However, multiple testing should be done with caution, as it can increase the risk of false positives.
4. Interpret Results Carefully
Non-parametric tests often provide p-values and effect sizes that are not directly comparable to those from parametric tests. It is important to carefully interpret the results and consider the limitations of the method.
5. Report Results Clearly
When reporting results, it is important to clearly state which test was used, how the data was analyzed, and what the results mean in the context of the research question.
6. Consider Sample Size
Non-parametric methods can be used with small sample sizes, but as with any statistical analysis, larger sample sizes generally provide more robust results.
7. Use Appropriate Software
There are many software packages available for performing non-parametric analysis. It is important to choose software that is appropriate for the research question and data type and to ensure that the software is used correctly.
Other Useful Tools and Concepts

While we’ve discussed some useful tests, statistical analysis is quite nuanced as a whole. As such, if you aren’t fully up to speed on how normal distributions work, you’ve got some homework. These common distributions are a cornerstone of any statistical analysis.
Further, you might need to take a closer and earnest look at your process data. Understanding the statistical significance between data points can make or break your analysis. As such, I heavily recommend our guide on the subject.
Conclusion
Non-parametric tests allow you to answer statistical questions when your data do not comply with the underlying assumptions of the tests. Many statistical tests have assumptions about specific characteristics or underlying distributions of the population data. For example, non-parametric tests are useful when your assumptions call for the normality of the data and your data is not normal.
There are non-parametric tests that mirror those of parametric tests. For example, a parametric test for two samples (2-sample t) will have an equivalent non-parametric test (Mann-Whitney). The difference is that the t-test will test for the difference between two means while the Mann-Whitney test will test the difference between two medians.
While the parametric tests will have more power for discerning differences, the non-parametric test will be sufficient in most cases. Parametric tests are also quite robust to violations of their assumptions especially when sample sizes are large enough. Non-parametric tests also have some underlying assumptions but they are not related to the population distributions.