Key Points
- Pooled standard deviation is an average of averages.
- You’d use it when comparing standard deviations between multiple data sets.
- Larger sample sizes can skew results.
When you have the average production of three machines, it is easy to calculate the average or mean production. You just add up the three means and divide by three. But what if I want the average standard deviation of the three machines? The pooled standard deviation is the way to go. Let’s see how.
Overview: What Is a Pooled Standard Deviation?
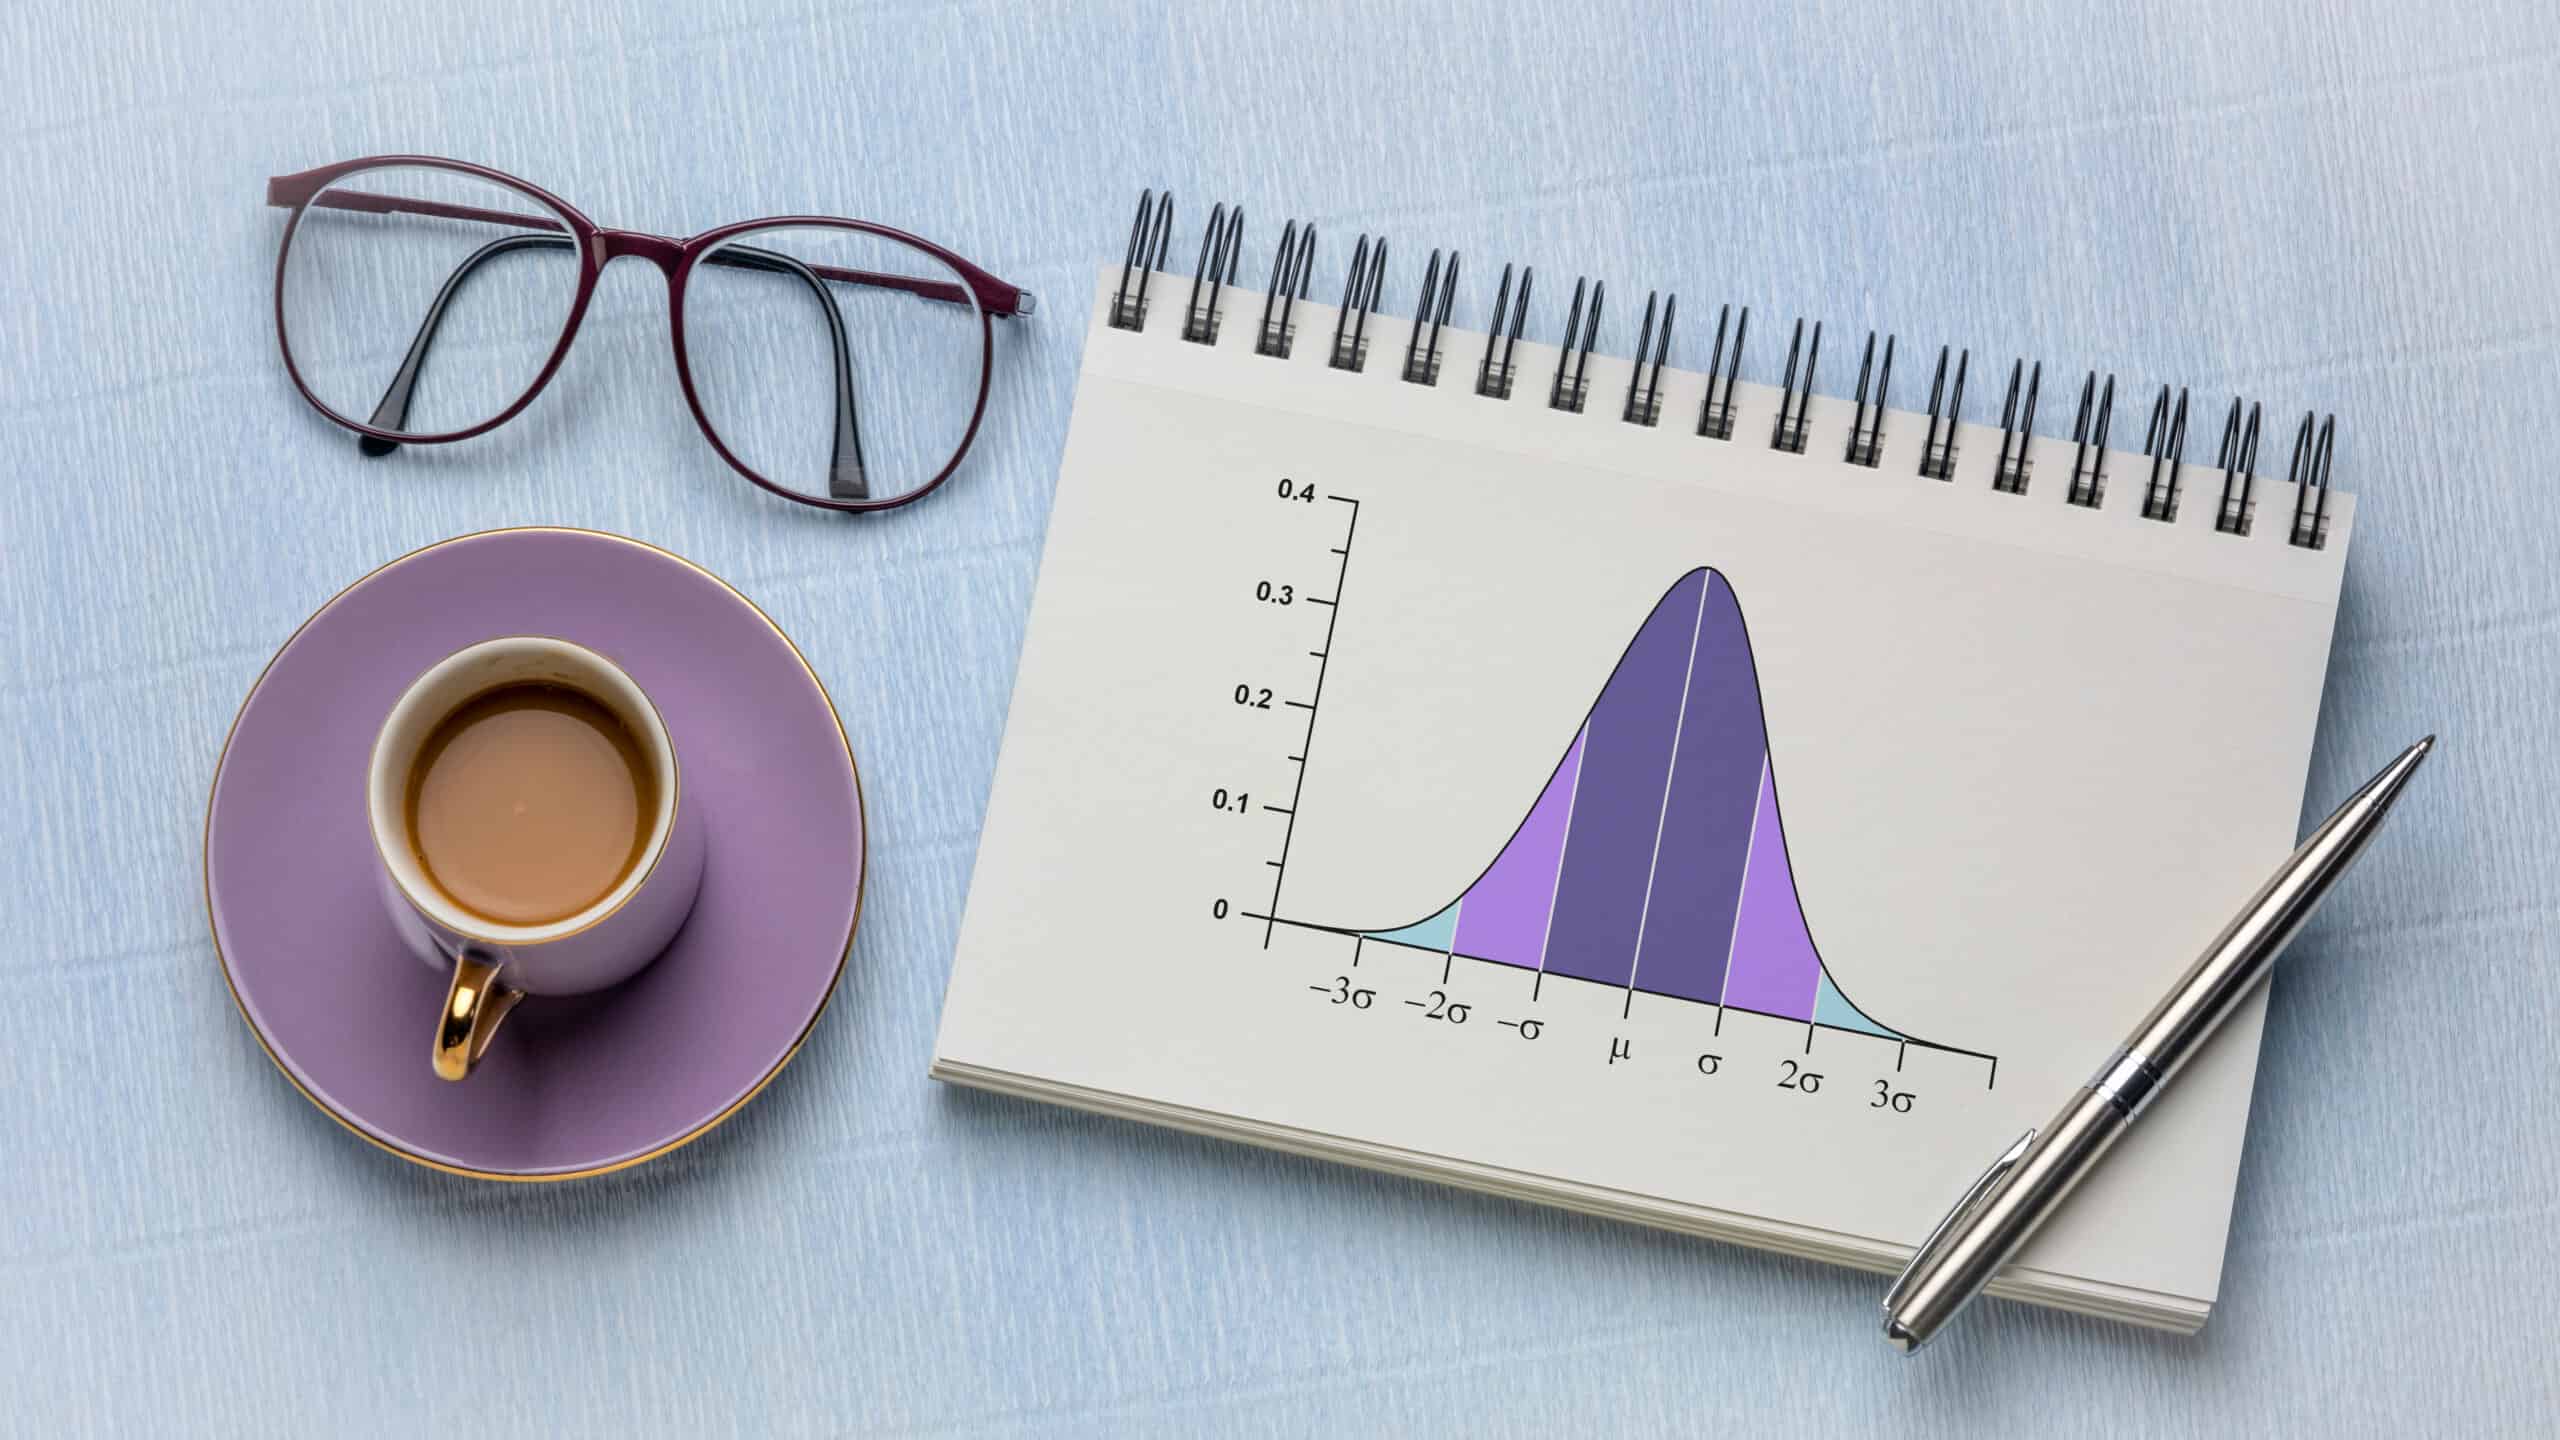
The definition of the standard deviation is the average distance each data point is away from the mean of the data. It is a measure of the variation, spread, or dispersion of the data around the mean. The standard deviation is the square root of the variance. Unfortunately, according to mathematical theory, you can’t do arithmetic operations with standard deviations, although you can with variances.
A pooled standard deviation is just a weighted average of the standard deviation (variances) from two or more groups of data when they are assumed to come from populations with a common standard deviation.
Weighting is a function of the sample size of each group. The larger the sample size, the greater the proportional effect will be on the overall estimate of the standard deviation.
Here is the generalized formula for it:

The formula for pooled standard deviation
In the formula above, n is the sample size of the group, S squared the group variance, and k is the number of groups. This assumes the variances are essentially equal. If not, a more advanced formula is needed.
Note how a larger sample size in the numerator would have a larger impact or weighting on the final result.
Pooled standard deviations are used in hypothesis testing, ANOVA, control charts, and process capability analysis.
Why Does It Matter?
Imagine you’re looking to see where improvements can be made in your processes. You could take the time and crunch numbers to see where variances might occur. If you’re running an ANOVA, it might be time for something like Tukey’s. However, a pooled standard deviation can cut out some of the harder work, getting you to the heart of the matter in no time at all.
An Industry Example of Pooled Standard Deviation
The manager of sales wanted to know the average sales of three offices as well as the variation as measured by the standard deviation. He easily calculated the average sales by adding up the average sales of his three offices and dividing by three.
Then he tried calculating the average standard deviation by doing the same thing. He added the three standard deviations and divided them by three to get an average of 5.1. Then he did the variances and got an average of 5.14.
The company Lean Six Sigma Black Belt walked by, saw what he was doing, and suggested he needed to do the pooled standard deviation – not the straight average deviation. The problem was, that he wasn’t accounting for the difference in sample sizes, so he was not properly weighting the standard deviations. The pooled standard deviation turned out to be 5.46.
Below are some of his calculations:


Other Great Concepts for the Toolbox
We’ve discussed pooled standard deviations at length, but what other tools might benefit your analysis? You’re likely going to be looking at Cpk and Sigma Level when viewing your production line. As such, understanding how they inter-relate and differ is key.
Further, you might need some extra help with your data analysis. If you don’t understand the differences between categorical and continuous data, then there is no time like the present. Our comprehensive guide breaks it down in clear and simple terms to deliver the best possible results.
Closing Thoughts
Pooled standard deviation is a useful tool when analyzing data sets. It is especially helpful when you’ve taken the time to properly weigh your standard deviations so everything is in balance. Learning how this concept works can greatly improve your experimentation, process, and statistical analysis as a whole.