When doing a Design of Experiments (DOE) you will have a dependent variable (Y) and one or more independent variables (X). This relationship is written as Y = f(X) and is spoken as Y is a function of X. To what degree your X has on your Y can be computed and illustrated by the main effect plot.
Overview: What is a main effect?
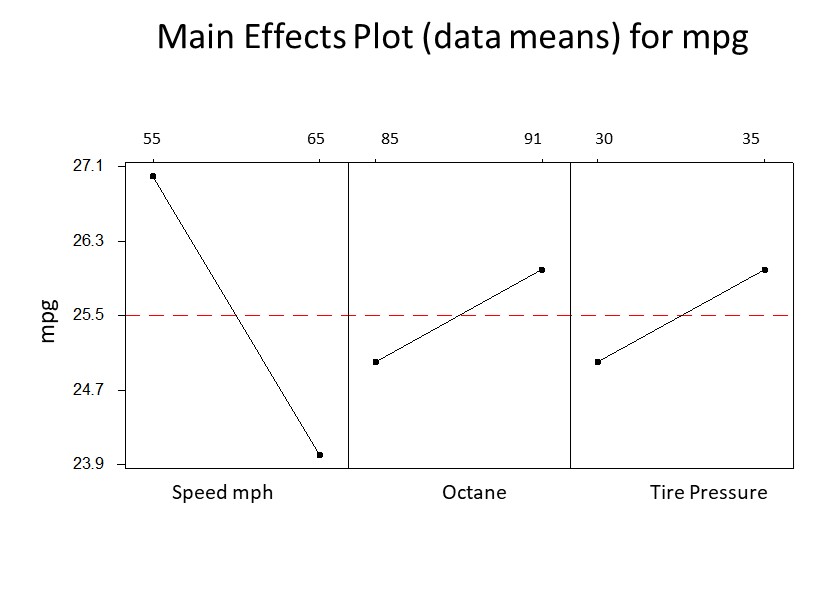
You have determined your car’s gas mileage (mpg) is your desired dependent variable and the speed you drive (55 or 65 mph), octane of the gas (85 or 91) and tire pressure (30 or 35 psi) are the independent variables you want to study. The question is which, if any, have an effect on your mpg?
You could run a simple DOE whereby you vary your independent variables at the levels described above and then determine how many miles per gallon you achieved. Your calculation for the main effect would be the miles per gallon you drove when driving at 55 mph and compare it to driving at 65 mph. The difference would be your main effect. The same could be done for the octane and tire pressure. Whether it was significant or not is a different story.
The following is a graphical output which most statistical software packages provide. The slope of the lines indicates the degree of effect the various factors have on your mpg. The mathematical difference on the vertical axis between the two points is your calculated main effect. It appears that all three factors have a main effect with Speed being the most dominant effect.

Note the average mpg for Speed has the sharpest slope while Octane and Tire Pressure also have slopes but are not quite as steep. An overall interpretation would have you concluding that by going from 55 mph to 65 mph greatly reduces your mpg. But, going from an octane rating of 85 to 91 increases your mpg and going from a tire pressure of 30 psi to 35 psi also increases your mpg.
An industry example of main effect
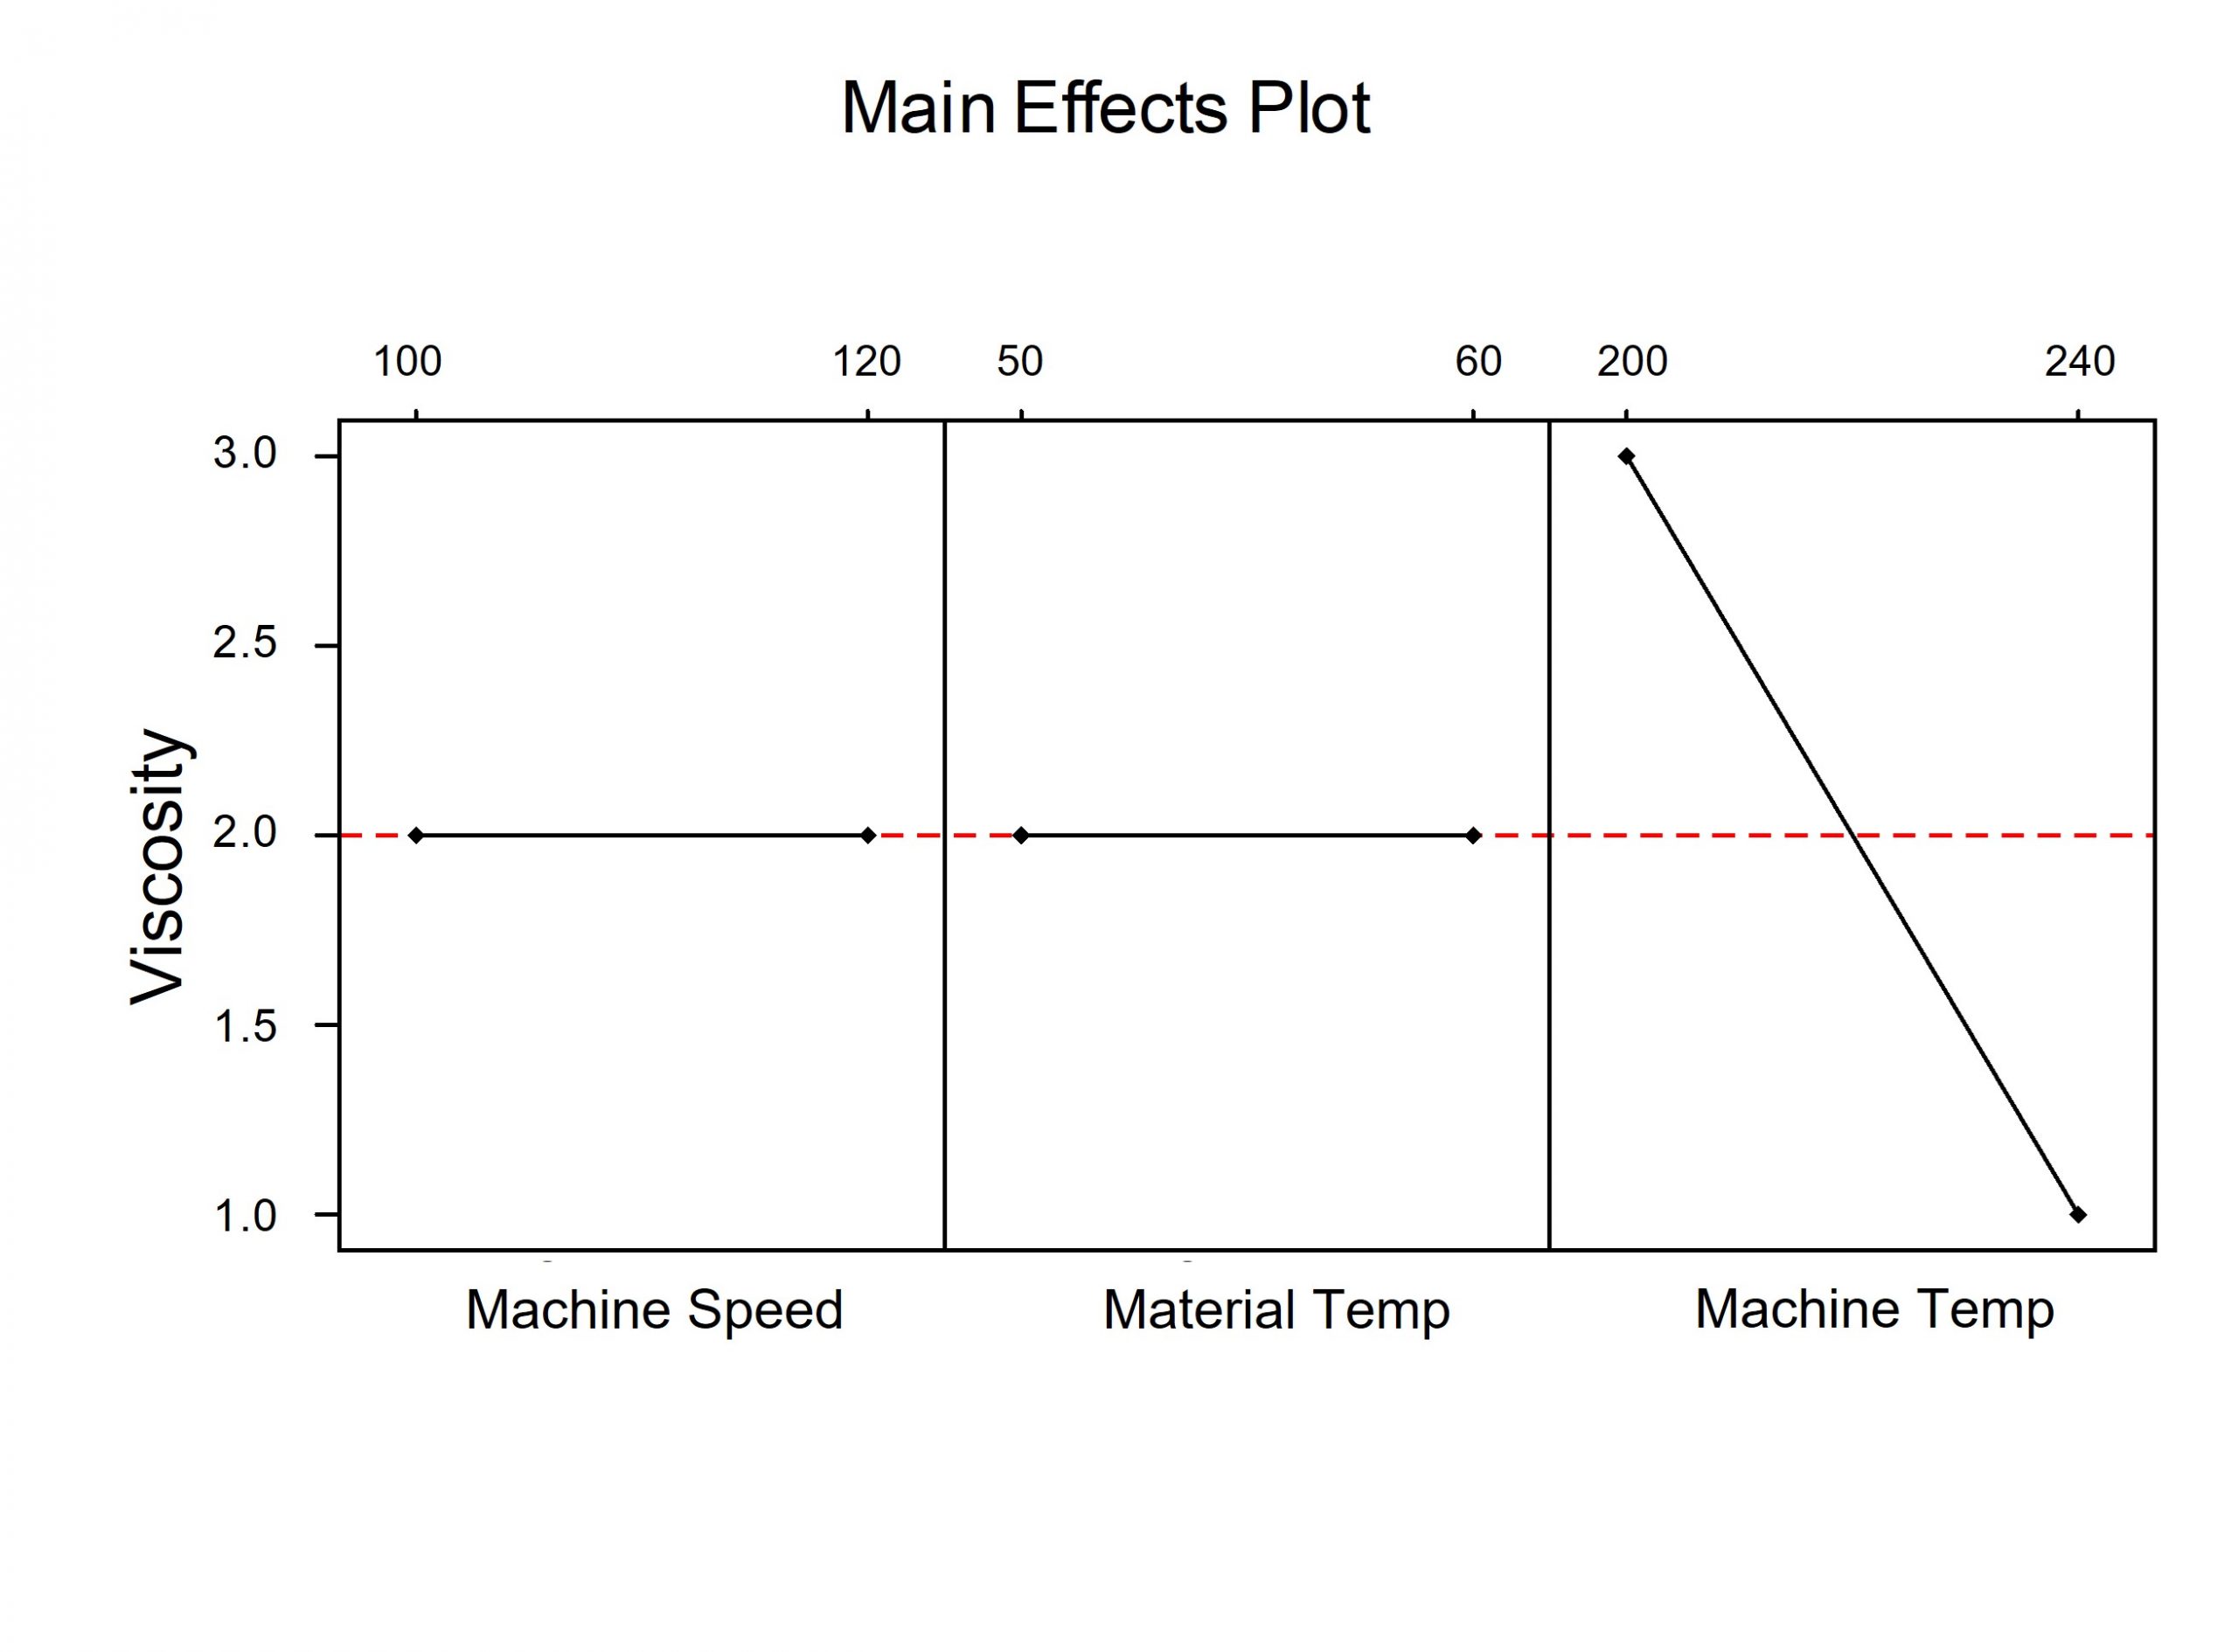
The company Six Sigma Master Black Belt (MBB) was tasked with determining what factors have a significant impact or effect on the viscosity of a common product the company produces. She set up a DOE and at the end, produced the main effects plot below. She interpreted the graph to mean the only factor with some significant effect is machine temperature. She visually drew this conclusion by looking at the slope of the three lines. Machine temperature was the only factor with a steep slope. She confirmed this with the p-value provided in the text output of the program.

Frequently Asked Questions (FAQ) about a main effect
How do I know whether a main effect is truly significant?
The slope of the line is a visual indicator where the steeper the slope the greater the impact. Most computer programs will also compute a mathematical value for the main effect and provide a p-value which can be interpreted as being a significant effect or not.
The main effect plot shows a linear relationship between the high and low settings for the independent variables. Is that always the case?
No. There may be a nonlinear relationship which you can test with the use of center points.
How are interaction effects different from main effects?
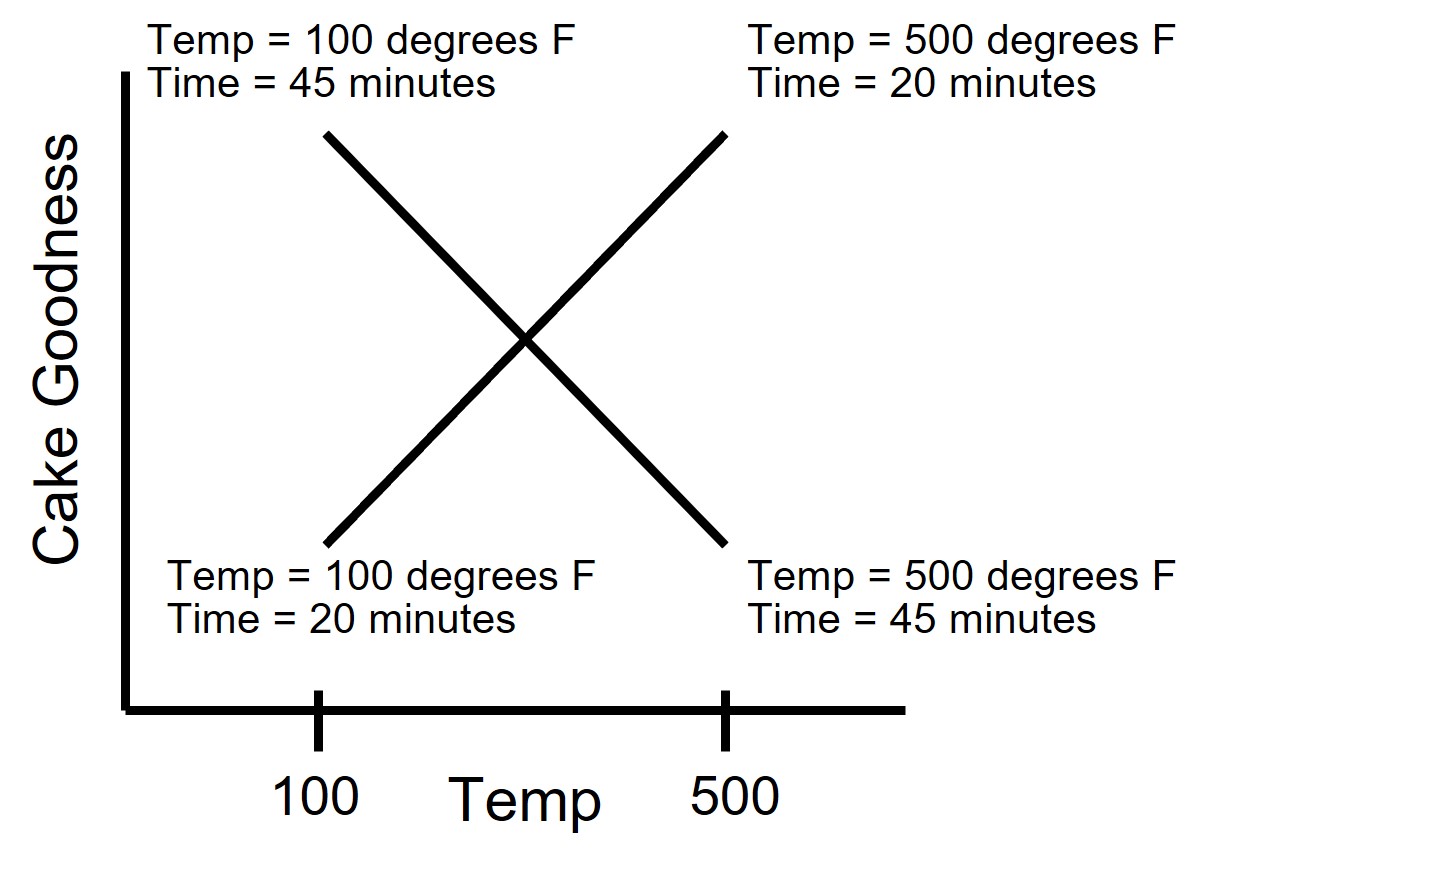
Main effects look at the effect of each factor separately. An interaction effect would tell you if the setting of one factor causes a change in the setting of another factor. For the example below, your DOE might conclude if you want to maximize your Cake Goodness you need to set your oven at 500 degrees F and cook for 20 minutes. But if you decide to set your oven at 100 degrees F, you will need to cook for 45 minutes. That is an interaction effect.
