With more than 1,000 trained Black Belts, the U.S. Army continues marching forward in its Lean Six Sigma efforts. Trained Black Belts who complete projects and obtain certification are essential to building a robust cadre of practitioners. To this end, the Army formalized the use of Belt course portfolios (BCPs), the collection of projects assigned to all personnel attending a particular Black Belt course, within its project-tracking software and deployed a web application to streamline the information-generation process.
The goals of displaying Belt certification progress through the BCP and web application are:
- To empower deployment managers with accurate, timely information.
- To provide increased situational awareness of the project status.
- To enhance the ability of managers to persuade Black Belt progress toward project completion and certification.
Tracking Measures of Effectiveness
Crucial to certifying more Black Belts are the measures to assess the deployment system’s effectiveness. Black Belt candidates enter the system with a project, attend four weeks of training (one week per month for four months), and complete the DMAIC phases of their project in accordance with the standard project completion timeline (Table 1). The timeline is defined according to the Army Lean Six Sigma Deployment Guidebook, Version 3.0.
| Table 1: Standard Project Completion Timeline | |
| Training Week of Black Belt Course | Should-be Status |
| Week 1 | In Define |
| Week 2 | In Measure |
| Week 3 | In Analyze |
| Week 4 | In Improve |
| Week 4 + 1 month | In Control |
| Week 4 + 2 months | Complete |
Candidates are not on their own in these endeavors; they are assisted by a seasoned Belt coach and project sponsor. To track progress, deployment managers need quantifiable measures of effectiveness. Only well-defined measures provide ways to contrast current project status to the desired, or should-be, status, and to calculate the amount of improvement needed to obtain the desired status.
The measures of effectiveness are defined as:
- Number of candidates who complete the Define tollgate by Week 2 of training
- Number of candidates who complete the Measure tollgate by Week 3 of training
- Number of candidates who complete the Analyze tollgate by Week 4 of training
- Number of candidates who complete a project and gain certification by two months after Week 4 of training
- The percentage of projects in compliance with the standard project completion timeline
These measures permit deployment managers to contrast current portfolio project statuses with the should-be project statuses.
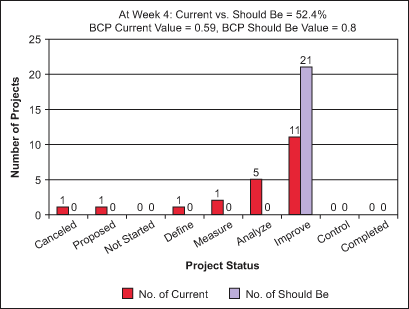
For example, consider a BCP of 21 Belts in Week 4 of training, when all 21 projects should be in the Improve phase. A simple bar graph juxtaposing current and should-be project status displays the deployment system’s effectiveness for this portfolio (Figure 1). Deployment managers can see that only 11 of 21 projects, or 52.4 percent, meet the standard project timeline. If the deployment system achieved the optimal effectiveness, the red bar and blue bar would be the same height, and no projects would be in the “Canceled,” “Proposed” or “Not Started” statuses. Projects in these statuses denote opportunities lost.

The graph and measures of effectiveness present a straightforward visual of the health of the BCP. Armed with this project status situational awareness, managers can engage project sponsors and Belt coaches to influence progress. A net result is an increase in the effectiveness of the deployment system for producing Army-certified Black Belts.
Calculating Belt Course Portfolio Value
Graphs resembling Figure 1 offer a snapshot of the portfolio’s advancement and an excellent means to evaluate a course portfolio. A more useful figure, however, is needed to present the trend of portfolio progress.
The BCP value is a more robust measure of effectiveness. The basis for the BCP value is the numerical value for each possible project status (Table 2). Because projects in Canceled, Proposed and Not Started are potential lost opportunities at any week of training, they are assigned negative values. The numerical average of the individual project values is the BCP value.
| Table 2: Calculating Belt Course Portfolio Value at Week 4 | |||
| Project Status | Status Value | No. of Projects in Status | Staus Value x No. of Projects in Status |
| Canceled | -0.067 | 1 | -0.067 |
| Proposed | -0.033 | 1 | -0.033 |
| Not Started | 0.0 | 0 | 0 |
| Define | 0.2 | 1 | 0.2 |
| Measure | 0.4 | 2 | 0.8 |
| Analyze | 0.6 | 5 | 3.0 |
| Improve | 0.8 | 11 | 8.8 |
| Control | 0.9 | 0 | 0 |
| Completed | 1.0 | 0 | 0 |
| Total = 21 | BCP Value = 12.7/21 = 0.60 | ||
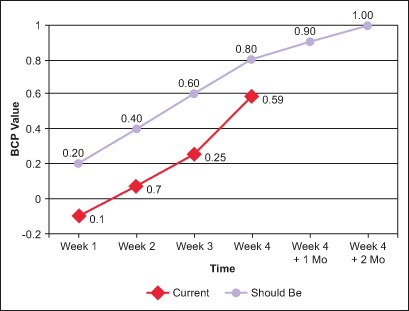
This technique is used to calculate the BCP values for Week 1 and onward. If all projects were in the correct status, the BCP value would be the status value. For example, at Week 4 the BCP value should be 0.8 (0.8 x 21 = 16.8, 16.8/21 = 0.8) rather than 0.60. Figure 2 graphs the trend of the BCP values for the current and should be statuses. Akin to Figure 1, this visual comparison is a starting point for discussions and corrective action.

Analysis indicates that on average the projects lag behind the standard project completion timeline; however, noticeable improvement occurred between Weeks 3 and 4. The BCP value more than doubled between these weeks. Project sponsors, Belt coaches and Belts completed 22 project advances (such as replacing Canceled projects, starting Not Started projects and completing DMAIC phases).
Continued manager monitoring of the BCP value and emphasis on the advancement of projects helps maximize the number of projects in compliance with the standard timeline. The benefit is trained Black Belts who complete projects and are thereby closer to obtaining certification and strengthening the Army’s deployment.
Streamlining the Information Generation Process
While these figures showing the measures of effectiveness are useful, the information-generation process is complex and time consuming. The process involves extracting data from the project tracking system, data manipulation within spreadsheets and databases, and distributing graphs and charts to the right people. For up-to-date information, this process must be repeated when project statuses change. Rather than devoting time on data extraction and manipulation, and creating graphs, deployment managers and their staff should focus their limited time on effecting project completions and certifications. In order to do so, they needed a solution capable of streamlining the information generation process.
The solution was to adopt an Internet-based web application that performs data manipulation and calculations, and dynamically displays information. Because the application is web-based, a large audience can use one application with one set of computational rules and linkage to the data source of record. Differences in data definitions, currency of data and application version were eliminated.
Moreover, the application empowered managers to easily obtain products for decision making. Deployment managers could reallocate the time previously devoted to information generation to influencing project completion.
Enhancing Capabilities
While the BCP methodology and web application are initiatives within the Army for Black Belts, the methodology and the application can enhance the capabilities of other services. It also can benefit Green Belt cadre assessment. Informal discussions with personnel within the U.S. Department of Defense suggest the need for a more effective and efficient means of monitoring the training and analysis of Belt project completion.