Key Points
- SIPOC diagrams are used to identify all elements of a process improvement project.
- Diagrams are created during the Measure stage of Six Sigma DMAIC.
- Creating these diagrams allows your team to visualize the entirety of a project.
- They’re useful for complex projects, especially if the scope isn’t defined.
- These are best implemented in a team setting with sponsor, champion, or stakeholder approval being paramount.
There are a few different ways you can improve a process in your business. Before you get to work with implementing these changes, it does help to visualize the entire thing. A SIPOC diagram is a highly useful tool for mapping out the steps of a process. Processes and projects are complex, but a SIPOC diagram can help cut through the minutia to get your team back on track.
What Is a SIPOC Diagram?

A SIPOC diagram is a tool used by a team to identify all relevant elements of a process improvement project before work begins. It helps define a complex project that may not be well-scoped and is typically employed at the Measure phase of the Six Sigma DMAIC (Define, Measure, Analyze, Improve, Control) methodology. It is similar and related to process mapping and ‘in/out of scope’ tools, but provides additional detail.
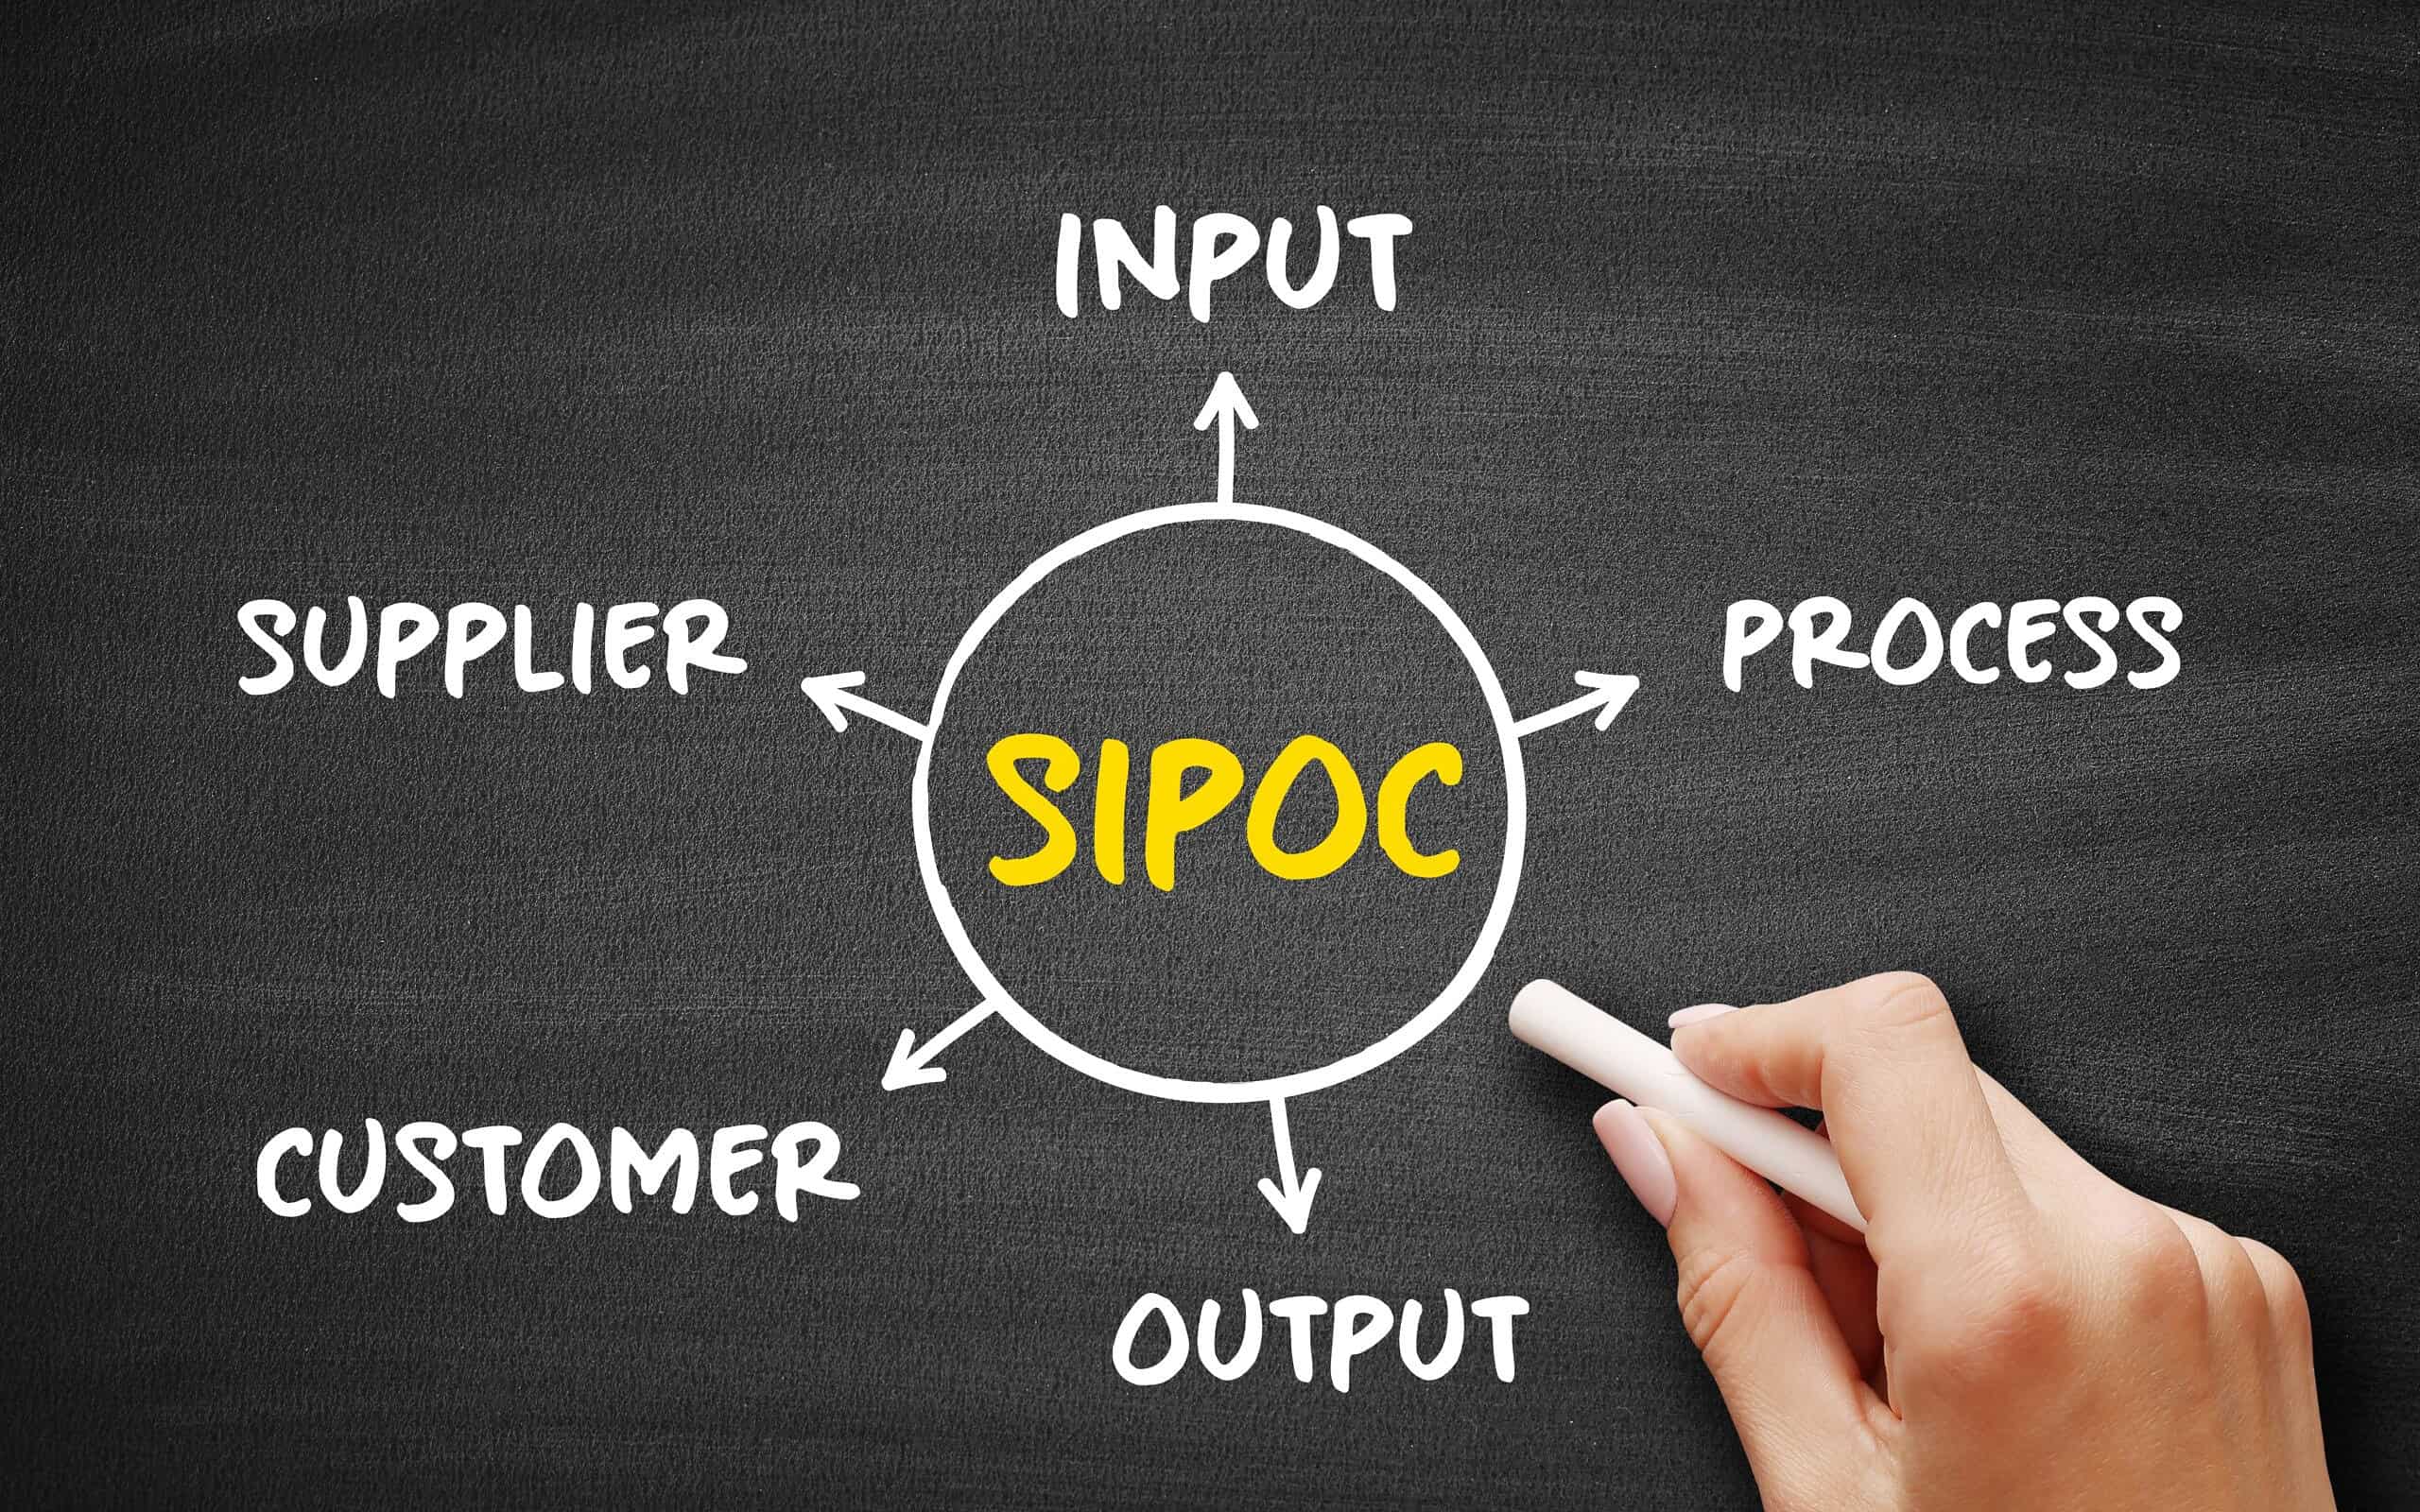
This tool prompts the team to consider the suppliers (the ‘s’ in SIPOC) of your process, the inputs (the ‘i’) to the process, the process (the ‘p’) your team is improving, the outputs (the ‘o’) of the process, and the customers (the ‘c’) that receive the process outputs. In some cases, your customer’s needs can be appended to the end of the SIPOC Diagram for further detail.
The SIPOC tool is particularly useful when the following questions aren’t clear:
- Who supplies inputs to the process?
- What specifications are placed on the inputs?
- Who are the true customers of the process?
- What are the requirements of the customers?
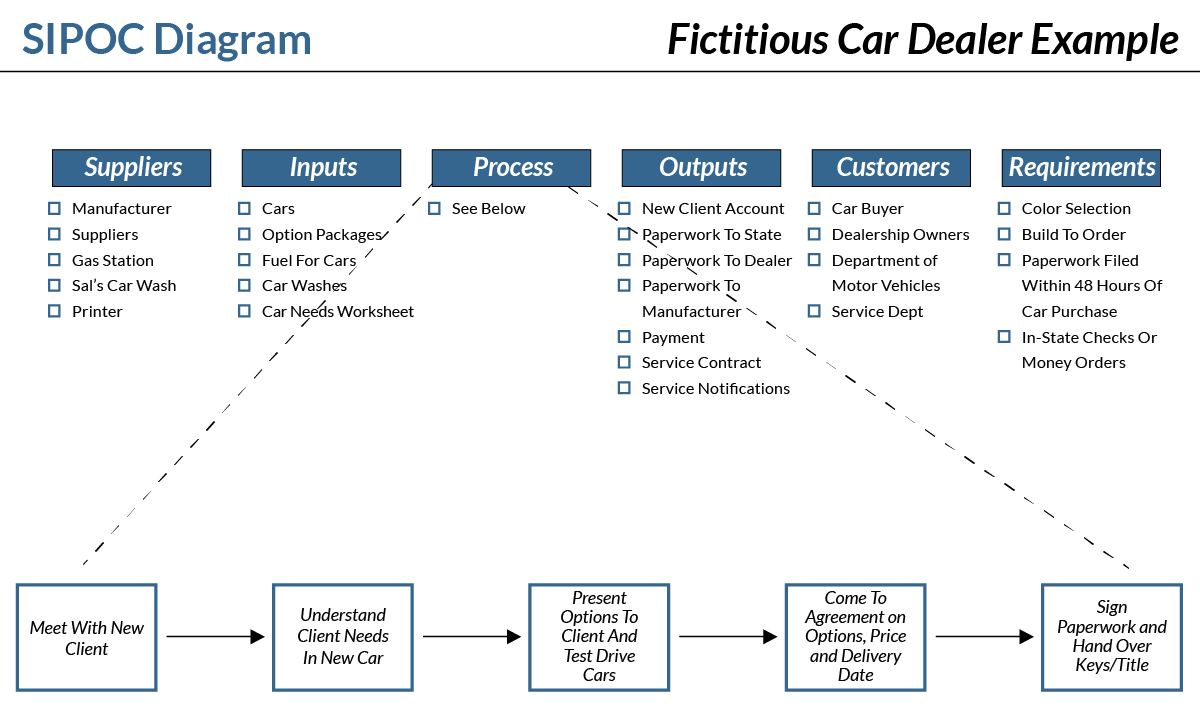
Sample SIPOC Diagram
A SIPOC diagram is a tool used by a team to identify all relevant elements of a process improvement project before work begins. It helps define a complex project that may not be well-scoped and is typically employed at the Measure phase of the Six Sigma DMAIC methodology.

Steps to Complete the SIPOC Diagram
SIPOC diagrams are very easy to complete. Here are the steps you should follow:
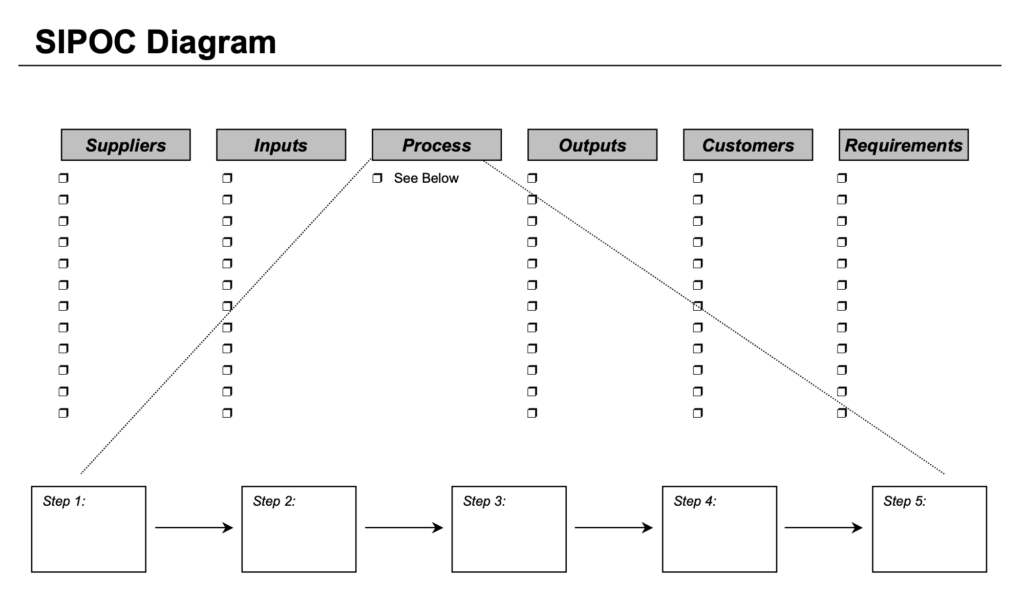
- Create an area that will allow the team to post additions to the SIPOC diagram. This could be a transparency (to be projected by an overhead) made of the provided template, flip charts with headings (S-I-P-O-C) written on each, or headings written on post-it notes posted to a wall.
- Begin with the process. Map it in four to five high-level steps.
- Identify the outputs of this process.
- Identify the customers that will receive the outputs of this process.
- Identify the inputs required for the process to function properly.
- Identify the suppliers of the inputs that are required by the process.
- Optional: Identify the preliminary requirements of the customers. This will be verified during a later step of the Six Sigma measurement phase.
- Discuss with the project sponsor, champion, or other involved stakeholders for verification.
The SIPOC diagram is a vital tool for teams working on process improvement projects. This is beneficial when there is uncertainty regarding the project’s scope. By breaking down the process into its core components, teams can gain a holistic view of the entire system.
This guarantees no critical elements are overlooked. Further, by identifying the suppliers, inputs, processes, outputs, and customers, teams can pinpoint potential bottlenecks, inefficiencies, or misalignments in the existing process.
Keeping stakeholders in the loop, like your project sponsor or Champion, during the SIPOC diagram creation process also allows your team to keep a comprehensive understanding of the project’s objectives and deliverables.
Real-World Uses of a SIPOC Diagram
Imagine for a moment you’re the team lead on a software development project. You’ve been given the specifications and intended results desired by a client for an application intended for medical bookkeeping. You meet with your development team on a Monday morning, primed and ready to define the scope of the project.
You would use the following data points for creating your SIPOC Diagram:
- Supplier: This would include project managers specifying application features, designers mocking up the user interface, and developers writing the actual code.
- Input: These are your feature requirements, coding guidelines, and any prototypes created.
- Process: You would account for the planning, coding, testing, and deployment. If your organization is utilizing Lean or Agile methodology, you would also plan for continuous iterations.
- Output: This is the final application, ready and waiting to be used by your intended users.
- Customer: The people using the software, stakeholders, or leaders who have invested in the project.
With these data points placed, you’re ready to move forward in the project. This tool is applicable across all industries, just like the other tools and concepts from Lean Six Sigma.
Useful Tools for Sure-Fire Results
Lean Six Sigma borrows heavily from the automotive and software industries for proven results. It goes without saying that if your organization has practitioners on staff, you should be implementing DMAIC. It is one of the cornerstones of the methodology and is a proven and tested tool.
Additionally, you might want to do a quick read on how to correct any potential miscommunication issues with your customers. After all, the cornerstone of any organization is listening to its customers and delivering reliable products or services.
The Benefits for Your Team

SIPOC diagrams aren’t going to be a cure-all for whatever is ailing your team. However, by clearly visualizing suppliers, processes, inputs, outputs, and customers you’re keeping a bird’s eye view of the entire project. This does have benefits. For example, leadership positions in your team can more readily make decisions and understand the impact those will have during the creation process.
Further, creating a SIPOC diagram with your team allows them to understand how the entire project fits together. Visualizing the pieces and understanding the flow from the concept stage to deliverable, helps to better streamline a project and get things back on track. So, should you implement a SIPOC diagram in your next project? The proof is in the pudding, so to speak. You are doing your team a disservice by not drawing one of these out early in a project’s lifespan.