© Ground Picture/Shutterstock.com
Key Points
- Cp and Cpk rely on smaller sample sizes.
- Pp and Ppk look at the whole picture when analyzing data.
- Cpk and Ppk are larger scope calculations.
For many years industries have used Cp, Cpk, Pp, and Ppk as statistical measures of process quality capability. Some segments in manufacturing have specified minimal requirements for these parameters, even for some of their key documents, such as advanced product quality planning and ISO/TS-16949. Six Sigma, however, suggests a different evaluation of process capability by measuring against a sigma level, also known as sigma capability.
Incorporating metrics that differ from traditional ones may lead some companies to wonder about the necessity and adaptation of these metrics.
It is important to emphasize that traditional capability studies as well as the use of sigma capability measures carry a similar purpose. Once the process is under statistical control and shows only normal causes, it is predictable.
This is when it becomes interesting for companies to predict the current process’s probability of meeting customer specifications or requirements.
Capability Studies

Traditional capability rates are calculated when a product or service feature is measured through a quantitative continuous variable, assuming the data follows a normal probability distribution. A normal distribution features the measurement of a mean and a standard deviation, making it possible to estimate the probability of an incident within any data set.
The most interesting values relate to the probability of data occurring outside of customer specifications. These are data appearing below the lower specification limit (LSL) or above the upper specification limit (USL).
An ordinary mistake lies in using capability studies to deal with categorical data, turning the data into rates or percentiles. In such cases, determining specification limits becomes complex. For example, a billing process may generate correct or incorrect invoices.
These represent categorical variables, which by definition carry an ideal USL of 100 percent error-free processing, rendering the traditional statistical measures (Cp, Cpk, Pp, and Ppk) inapplicable to categorical variables.
Capability and Performance Rates
When working with continuous variables, traditional statistical measures are quite useful, especially in manufacturing. The difference between capability rates (Cp and Cpk) and performance rates (Pp and Ppk) is the method of estimating the statistical population standard deviation.
The difference between the centralized rates (Cp and Pp) and unilateral rates (Cpk and Ppk) is the impact of the mean decentralization over process performance estimates.
The following example details the impact that the different forms of calculating capability may have on the study results of a process. A company manufactures a product that has acceptable dimensions, previously specified by the customer, ranging from 155 mm to 157 mm.
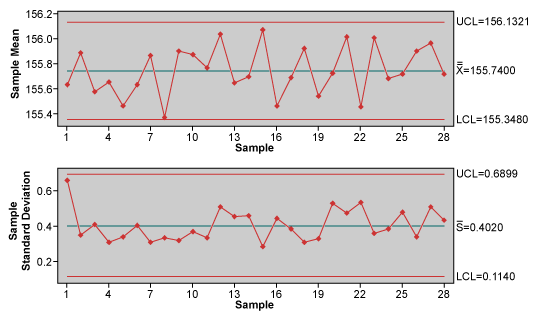
The first 10 parts made by a machine that manufactures the product and works during one period only were collected as samples for 28 days. Evaluation data taken from these parts was used to make an Xbar-S control chart (Figure 1).

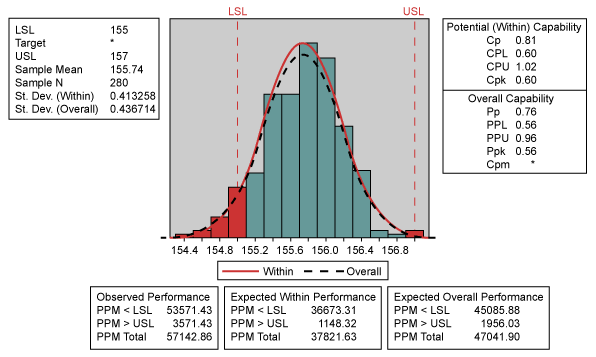
This chart presents only common cause variation and as such, leads to the conclusion that the process is predictable. Calculation of process capability presents the results in Figure 2.

Calculating Cp
The Cp rate of capability is calculated from the formula:

where s represents the standard deviation for a population taken from ![]() , with s-bar representing the mean of deviation for each rational subgroup and c4 representing a statistical coefficient of correction.
, with s-bar representing the mean of deviation for each rational subgroup and c4 representing a statistical coefficient of correction.
In this case, the formula considers the quantity of variation given by standard deviation and an acceptable gap allowed by specified limits despite the mean. The results reflect the population’s standard deviation, estimated from the mean of the standard deviations within the subgroups as 0.413258, which generates a Cp of 0.81.
Rational Subgroups
A rational subgroup is a concept developed by Shewart while he was defining control graphics. It consists of a sample in which the differences in the data within a subgroup are minimized and the differences between groups are maximized.
This allows a clearer identification of how the process parameters change along a time continuum. In the example above, the process used to collect the samples allows consideration of each daily collection as a particular rational subgroup.

The Cpk capability rate is calculated by the formula:
considering the same criteria of standard deviation.
In this case, besides the variation in quantity, the process mean also affects the indicators. Because the process is not perfectly centralized, the mean is closer to one of the limits and, as a consequence, presents a higher possibility of not reaching the process capability targets.
In the example above, specification limits are defined as 155 mm and 157 mm. The mean (155.74) is closer to one of them than to the other, leading to a Cpk factor (0.60) that is lower than the Cp value (0.81). This implies that the LSL is more difficult to achieve than the USL. Non-conformities exist at both ends of the histogram.
Estimating Pp
Similar to the Cp calculation, the performance Pp rate is found as follows:

where s is the standard deviation of all data.
The main difference between the Pp and Cp studies is that within a rational subgroup where samples are produced practically at the same time, the standard deviation is lower.
In the Pp study, variation between subgroups enhances the s value along the time continuum, a process that normally creates more conservative Pp estimates. The inclusion of between-group variation in the calculation of Pp makes the result more conservative than the estimate of Cp.
Regarding centralization, Pp and Cp measures have the same limitation, where neither considers process centralization (mean) problems. However, it is worth mentioning that Cp and Pp estimates are only possible when upper and lower specification limits exist.
Many processes, especially in transactional or service areas, have only one specification limit, which makes using Cp and Pp impossible (unless the process has a physical boundary [not a specification] on the other side). In the example above, the population’s standard deviation, taken from the standard deviation of all data from all samples, is 0.436714 (overall), giving a Pp of 0.76, which is lower than the obtained value for Cp.
Estimating Ppk
The difference between Cp and Pp lies in the method for calculating s, and whether or not the existence of rational subgroups is considered. Calculating Ppk presents similarities with the calculation of Cpk. The capability rate for Ppk is calculated using the formula:

Once more it becomes clear that this estimate can diagnose decentralization problems, aside from the quantity of process variation. Following the tendencies detected in Cpk, notice that the Pp value (0.76) is higher than the Ppk value (0.56) because the rate of discordance with the LSL is higher.
Because the calculation of the standard deviation is not related to rational subgroups, the standard deviation is higher, resulting in a Ppk (0.56) lower than the Cpk (0.60), which reveals a more negative performance projection.
Calculating Sigma Capability
In the example above, it is possible to observe the incidence of faults caused by discordance, whether to the upper or lower specification limits. Although flaws caused by discordance to the LSL have a greater chance of happening, problems caused by the USL will continue to occur. When calculating Cpk and Ppk, this is not considered, because rates are always calculated based on the more critical side of the distribution.
To calculate the sigma level of this process it is necessary to estimate the Z bench. This will allow the conversion of the data distribution to a normal and standardized distribution while adding the probabilities of failure above the USL and below the LSL. The calculation is as follows:
- Above the USL:

- Below the LSL:

Summing both kinds of flaws produces the following result:
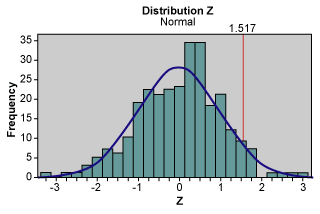
![]() (Figure 3)
(Figure 3)

The calculation to achieve the sigma level is represented below:
Sigma level = Zbench + 1.5 = 1.51695 + 1.5 = 3.1695
There is great controversy about the 1.5 deviation that is usually added to the sigma level. When a great amount of data is collected over a long period, multiple sources of variability will appear. Many of these sources are not present when the projection is ranged to a period of some weeks or months.
The benefit of adding 1.5 to the sigma level is seen when assessing a database with a long historical data view. The short-term performance is typically better as many of the variables will change over time to reflect changes in business strategy, systems enhancements, customer requirements, etc. The addition of the 1.5 value was intentionally chosen by Motorola for this purpose and the practice is now common throughout many sigma level studies.
When Do You Use Which?

Before you start pulling your hair out, let’s take a moment to look at which of these calculations applies to your processes. Cp and Cpk are used when analyzing data from the perspective of particular sets of data. When divided into subgroups, this is where Cp and Cpk shine.
Conversely, Pp and Ppk are utilized when taking a closer look at the bigger picture. You aren’t analyzing subsets of data, but rather the whole thing.
Other Useful Tools and Concepts
Need more materials to supercharge your knowledge? If you’d like to explore the differences between these calculations in more depth, our guide covering it is equally in-depth, providing key insights into how they work and where they’re applicable.
Additionally, you might need to calculate your capability index with a single specification. This isn’t ideal, as you can tell. But, thankfully we’ve got a guide on how to do so with ease.
Comparing the Methods
When calculating Cp and Pp, the evaluation considers only the quantity of process variation related to the specification limit ranges. This method, besides being applicable only in processes with upper and lower specification limits, does not provide information about process centralization. At this point, Cpk and Ppk metrics are wider-ranging because they set rates according to the most critical limit.
The difference between Cp and Pp, as well as between Cpk and Ppk, results from the method of calculating standard deviation. Cp and Cpk consider the deviation mean within rational subgroups, while Pp and Ppk set the deviation based on studied data.
It is worth working with more conservative Pp and Ppk data in case it is unclear if the sample criteria follow all the prerequisites necessary to create a rational subgroup.
Cpk and Ppk rates assess process capability based on process variation and centralization. However, here only one specification limit is considered, different from the sigma metric. When a process has only one specification limit, or when the incidence of flaws over one of the two specification limits is insignificant, sigma level, Cpk, and Ppk bring very similar results.
When faced with a situation where both specification limits are identified and both have a history of bringing restrictions to the product, calculating a sigma level gives a more precise view of the risk of not achieving the quality desired by customers.
As seen in the examples above, traditional capability rates are only valid when using quantitative variables. In cases using categorical variables, calculating a sigma level based on flaws, defective products, or flaws per opportunity, is recommended.
References
Breyfogle, Forrest W., Implementing Six Sigma: Smarter Solutions Using Statistical Methods, New York: Wiley & Sons, 1999.
Montgomery, Douglas C., Introdução ao Controle Estatístico da Qualidade, New York: Wilwy & Sons, 2001.
The image featured at the top of this post is ©Ground Picture/Shutterstock.com.