In Six Sigma work, practitioners normally are expected to conduct a gage R&R study to verify that that the measurement systems being used are providing measurements free from variations due to repeatability and reproducibility problems. This is usually done in the Measure phase of DMAIC (Define, Measure, Analyze, Improve, Control) prior to data analysis so that a project team does not end up with conclusions that are based on measurement system variation instead of process variation.
Especially in data-mature sites like most manufacturing plants, a gage R&R is sometimes skipped because past data is always readily available and assumed to be reliable. Or, pressed for time, Six Sigma teams sometimes assume that the data that they have is free from gage R&R problems and proceed to draw conclusions from the data. Using inaccurate measurements of process variation can result in a team failing to identify real root causes or, even worse, the wrong solutions to the problem.
While it is wrong, the practice of moving forward without a gage R&R is undoubtedly wide spread.
A Simple Test for Measurement System Reliability
There is another way to check measurement reliability that is not well-known and thus little used. Six Sigma project teams can perform a simple hypothesis test using the data they have to check for measurement system problems without a formal gage R&R study. The approach is especially focused on reproducibility problems and can be used whenever there is a potential issue using different appraisers and/or different types of measurement equipment.
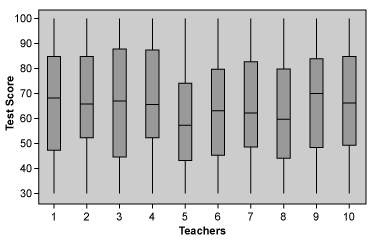
The validity of the test is best illustrated by an example: Suppose a school administers the same math test to 1,000 students. Ten math teachers are assigned to mark these 1,000 test papers. The test papers are assigned randomly so that each teacher has 100 test papers to mark. Because these teachers are math teachers, it is assumed there is no need to give them the correct answers. The teachers throw away the actual tests and report only the scores for each of their 100 papers. It suddenly dawns on the school’s administration that some of the teachers may be either consistently giving higher or lower marks. How can the school find out if this is true?
The logic of the test is: The 1,000 test scores have an underlying distribution. This can be any distribution but most probably, it is a normal distribution. In the case of a very brilliant group of students, the distribution is skewed to the left, or in the case of a group of very dull students, the distribution is skewed to the right.
Whatever the population distribution, the teacher’s sample distribution should have the same shape and almost same mean/median unless the teacher is either too lenient or too strict or just plain incompetent.
Using the Appropriate Hypothesis Test
Hence, using the appropriate hypothesis test (ANOVA, Kruskal-Wallis, Mood’s Median Test), one can find out if there is in fact any difference among teachers (i.e., are teachers causing the variation in the test scores). If the teachers are all good, the test should not be significant.


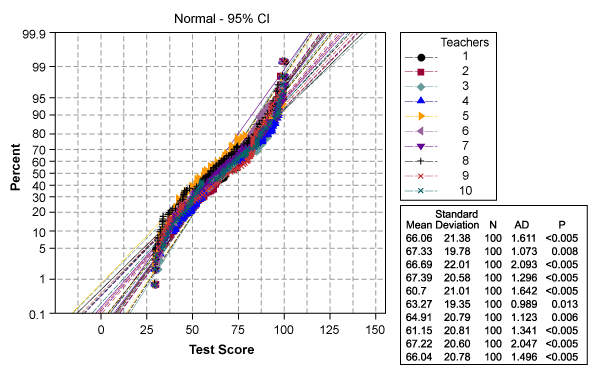
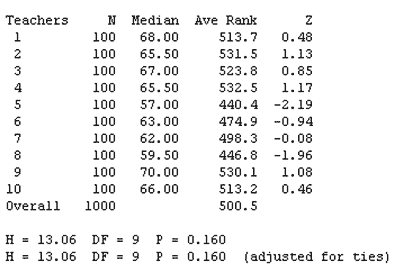
In the example, since the data is not normal as shown by the Anderson Darling Test (in the probability plot), it would be more appropriate to test using a non-parametric test:

In this case, since the test is not significant (p-value is greater than 0.05), the school can conclude that the measurement system (the teachers) are okay.
Applying the Example to Use in Industry
In most industry data, there is data similar to the math test example. For instance, in a project, the Six Sigma team might be wondering if inspectors were all equally diligent in spotting a particular type of defect in a product. Given the large volume of production, it would reasonable to expect the distribution of the percent defect across a long time (half a year) to show no significant difference between inspectors. However, to the team’s dismay, it did. This means that some inspectors are either spotting too many or too few defects, and the project team cannot be sure that the time variation in defects is due to inspectors or the process. Hence, the team must discard that data (of which it had a lot) and recollect data using trained inspectors verified by a formal gage R&R study.