An essential component of any Six Sigma project is the gage R&R step conducted during the Measure phase. Traditional training will cover the full analysis of variance (ANOVA) of a set of continuous data, an attribute gage R&R for discrete data and the destructive gage R&R. Since it is sometimes difficult to apply these tools in transactional projects, the best approach is to first ask the question, “Do I understand what my data represents and can I trust it?”
The Nature of Manufacturing and Transactional Data
Transactional projects are focused on improving performance as measured by a customer-driven metric. Examples include variance to an expected delivery date, accuracy of the terms in a contract, and cycle time for quote-to-order, order-to-ship, or ship-to-remit activities. The collection of reliable data is quite a different challenge for transactional projects than it is for manufacturing projects.
| Financial Transaction Data from Different Systems |
| $218,975,”SW”,,,”211″,11/17/03 3:28:53 P” |
| $3242.00,”SW”,,,”212″,,, |
| $20,742.01,”Central”,,,”212″,”17/11/2003 3:30:52 PM” |
| 18451,”SW”,,,”213″,”03/11/17 3:31:14 PM” |
| 653678,”Asia”,,,”214″,”17/11/2003 15:29:00″ |
In the transactional world, data is usually gathered at disparate locations and it is often gathered in a different manner at each location. It is difficult or impossible to make multiple measurements of the same purchase order, or process the same insurance claim 10 to 20 times to check the reliability of the cycle time data.
The adjacent set of data came from four separate financial processing systems, all feeding a single database. None of the data points were repeat measurements, but a glance at the list showed a number of problems with inconsistent units of measure. Different system settings on the individual machines resulted in different date and currency formats with subsequent errors in entry times for the five entities when the data was uploaded and merged.
Call Center Response Time Project – Misleading Data
The importance of accurate data is illustrated by a call center Six Sigma project that uncovered this issue. A major equipment manufacturing company was receiving complaints that the response time for technical queries was poor. During this same time, management within the unit perceived the performance as satisfactory.
The project started with a low-resolution process mapping exercise as part of the Define phase. When a query was received, an incident report was created and logged automatically with a time/date stamp. The call screener would obtain the desired response time from the customer and enter the query into one of three queues – emergency, medium or low priority. The screener was aware of the size of the input queues and could estimate the response time before informing the customer and entering a promised time/date into the system.
An engineering staff managed the three queues and responded directly to customer issues. They logged their actions on the same information system. The manager of the facility received weekly reports on the differences between promised and complete time/date results as well as the average cycle time for each step.
The initial data analysis showed that the variance to promised date and cycle times in each of the three categories was stable and within acceptable limits. When the management reports were generated once again, the performance metrics were identical, but the general feeling from the team was that the data was unreliable.
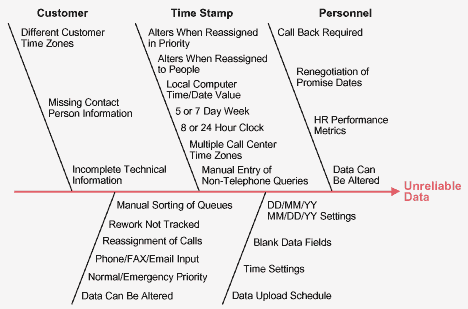
As a result, the scope of the project was changed by altering the defect definition from “on time customer response” to “unreliable data.” Team identified root causes, which were sorted into clusters and summarized in a Fishbone diagram (Figure 1) and the focus of the project became to redesign the data collection and metric reporting process.

The Transactional Data Audit
As illustrated by the call center project, it is important to begin a transactional project by conducting a data audit. If the data is shown to contain inaccuracies, a team brainstorm session on the causes of unreliable data is quite helpful. Once the results are documented, the team should fully answer the following questions:
- What are the date and time formats for each element of each transaction? This may require design of a discrete data sampling plan.
- What is the range of values for execution time for each process step? Plot them and investigate large or negative values.
- Are constant units of measure used within the data set?
- Are all assumptions, effects and patterns of missing data checked?
- Does anyone have access to the original data and can it be altered after the fact?
- Is the start time of a process step assumed to be when the previous step ended? People are usually keen to track when they complete a task, but not when they started.
- Is rework time captured correctly?
- What is the effect of changing time zones?
- Do different parts of the business have different days and hours of operation?
- Does each data point correspond to a real measurement? One business was using the customer’s freight company for final delivery. Since they did not have access to the freight company records, the delivery date was simply set as the shipment date plus 14 days and reported as such to the customer.
- Would your customers recognize your defect definition (e.g., What does 27 percent on-time departure mean in the airline business)?
- Does the date of transaction represent the viewpoint of the customer?