A power distribution company in India, serving domestic, commercial, industrial and agricultural users, was not meeting the country’s performance standard regulations for metering and billing. A Six Sigma project was initiated to reduce cycle time.
By Dibyajyoti Bandyopadhyay
A power distribution company in India, catering to the needs of domestic, commercial, industrial and agricultural users, was not meeting the country’s Electricity Regulatory Commission performance standard regulations for metering and billing. Those standards require the company to provide new power connections within 30 days from the date an application is received. In each case that the company was unable to meet the standard, it was required to pay a penalty for the delayed connection. This translated into an annual cost of 1,980,000 Rupees (US$46,000). A Six Sigma DMAIC project was initiated to reduce cycle time. This is the case study of that project.
Improvement Opportunity: The Define/Measure Phases
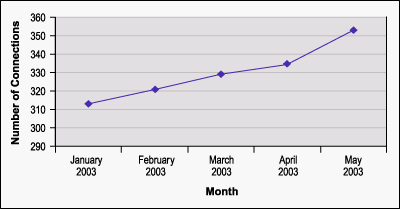
The project scope was limited to the process of providing new power connections to users up to a 100kw load in approved and electrified areas where the power supply network exists. The defect was defined as any new power connection that required more than 30 days to complete. Data collected for a five-month period showed an increasing trend in the number of defects with an average of 330 per month (Figure 1). Completion of the data collection plan yielded the information reflected in Table 1.
| Figure 1: Monthly Status of Pending Connections After Stipulated 30-Day Time Limit |
 |
Table 1: Summary Statistics of Collected Data
|
Standard Error |
1.1 |
|
|
Median |
41.0 |
|
|
Mode |
31.0 |
|
|
Standard Deviation |
25.6 |
|
|
Sample Variance |
654.5 |
|
|
Kurtosis |
4.7 |
|
|
Skewness |
1.8 |
|
|
Range |
171 |
|
|
Minimum |
2 |
|
|
Maximum |
173 |
|
|
Sum |
27328 |
The project targeted benefits included cost savings associated with the amount paid in penalties, local conveyance expenditures, employee costs, and document handling as well as an increase in customer satisfaction.
Analysis and Interpretation: The Analyze Phase
A cross-functional team was formed to prepare a process map with each activity identified by one of three categories – real value-added, business value-added, non-value-added – based on the following criteria:
Real value-added included essential activities that transform inputs into outputs that are necessary to meet customer requirements and have perceived value to the customer.
Business value-added included activities that are installed by management and deemed necessary to support, control, and monitor internal business functions but have little or no perceived value to the customer.
Non-value-added included nonessential and non-processing activities that do not contribute to customer satisfaction or improved business operations.
The results of the analysis showed that only 19 percent of the process activities are real value-added. From a time study carried out to estimate the standard man-minutes required for performing each process activity, it was determined that the process required a maximum time of 8.2 hours. Real value-added activities comprised only 25 percent of the overall processing time (Table 2) indicating that in some stage of the process, significant breakdowns were occurring.
Table 2: Analysis of Various Activity Categories
| Sub-Cycle Time | Definition |
|
Sub-Cycle Time-I (SCT-I) |
Time between date of receipt of application and date of demand note preparation |
|
Sub-Cycle Time-II (SCT-II) |
Time between date of demand note preparation and date of printing of demand note |
|
Sub-Cycle Time-III (SCT-III) |
Time between date of printing of demand note and date of payment by customer |
|
Sub-Cycle Time-IV (SCT-IV) |
Time between date of payment by customer and date of progress card generation |
|
Sub-Cycle Time-V (SCT-V) |
Time between date of progress card generation and date of energizing |
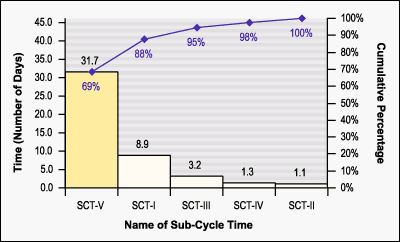
The Pareto analysis of the sub-cycle times revealed that two cycles were accounting for 88 percent of the total time (Figure 2).
|
Figure 2: Contribution of Each Sub-Cycle Time |
|
|
A brainstorming session identified the significant factors affecting these times. From that information, solutions were identified.
Recommendations: The Improve Phase
To redesign the process all non-value-added activities were eliminated, business value-added activities were minimized, and real value-added activities were streamlined. Key improvements included the following:
-
The application form and agreement form were combined, reducing the number of required documents and eliminating duplicate information.
-
Databases related to meter reading status and bill payment status of existing customers were made accessible online to detect potential status issues before accepting the application. Detection at the application receiving stage rather than at a later stage helped reduce rework and improve customer satisfaction.
-
Systematic calculations of charges and implementation of an e-mail messaging system for communication of potential issues made the process flow faster and be less prone to errors.
The redesigned process was piloted in one district during a four-week period. A time study was carried out to estimate the standard man-minutes required for performing each activity in the new process (Table 4). Results were positive, with the new standard deviation set at 4.8 days and the mean total cycle time reflecting 12.1 days, a substantial reduction over the previous process mean of 46.2 days. In addition, the number of activities in the process was reduced from 74 to 36.
Table 4: Analysis of Various Activity Categories
|
Activity Category |
Number of Activities |
Estimated Standard |
Estimated Maxium |
|
Real Value-Adding |
9 |
1.7 |
32.7% |
|
Business Value-Adding |
27 |
3.5 |
67.3% |
|
Non-Value-Adding |
0 |
0.0 |
0.0% |
|
Total |
36 |
5.2 |
100.0% |
At Last: The Control Phase
To monitor and control ongoing process performance, the company implemented a database to track each application and monitor the key sub-cycles. A concise reporting format also was developed to track the weekly progress of energizing within each zone and the overall performance for each district.
A cost-benefit analysis conducted after full implementation of the new process in all zones quantified the net savings for the company (Table 5) and confirmed the success of the project.
Table 5: Cost-Benefit Analysis
|
Account Headings |
Amount (Rupees) |
Remarks |
|
Savings/per annum from: |
1,980,000 |
Based on past performance |
|
Total Annual Savings |
2,988,000 |
|
|
Expenditure per annum for: |
160,000 960,000 |
Based on cost of vans totaling 800,000 Rupees amortized |
|
Total Annual Expenditures |
1,120,000 |
|
|
Total Net Annual Savings |
1,868,000 |
Dibyajyoti Bandyopadhyay has been a consultant and trainer in Six Sigma and Quality Management System (ISO 9000, QS 9000) for eight years. His experience includes program implementation, process management, manpower planning, organization restructuring, production system design, modernization and technology upgrading. He has assisted many organizations in implementing ISO 9000 QMS. He has rendered consulting services to companies like Hindustan Electro Graphites, Indorama Synthetics (I) Ltd., Fujitsu Optel Ltd., Tata Power, Department of Telecommunications. He can be reached at [email protected].
