Robust Ground to Air Communication Receiver Case Study
FM data demodulator is a critical part of ground to air communication receivers used in aircrafts. It should be designed to minimize the bit error rate (BER).

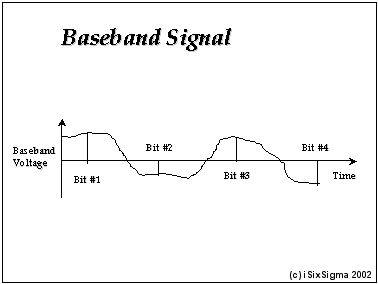
The main concept of demodulation is to convert the received RF signal to baseband voltage signal, sample it at the mid points of the bits and identify the bit as 0 or 1 using a threshold voltage value. Much design time and cost can be saved focusing on this main concept.
The corresponding ideal function has three forms:
- The time interval between consecutive level crossings should be proportional to the number of corresponding bits.
- The voltage level should be constant at the desired level, depending on whether it is 0 or 1 bit, between the level crossings.
- The voltage level for the bits should be proportional to the frequency deviation.

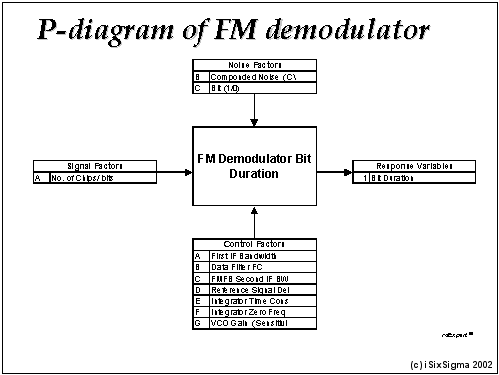
Only the first formulation is discussed here. A special sequences of bits was created that has consecutive “0” bit 1, 2, …, 7 times and the same for the “1” bit. The number of consecutive bits is the signal factor. The parameter C/KT defines broadband thermal noise affecting the transmission and is a key noise factor for this design. The bits 0 or 1 can also be viewed as a noise factor because the proportionality must hold for both the 0 and the 1 bit.

Computation of BER requires generation of millions of bits, which is costly. By using the ideal function and the corresponding zero point proportional type S/N ratio, one can greatly cut down the simulation effort. Indeed the team needed to generate a sequence of only 100 bits to evaluate the S/N ratio
The above figure shows the P-diagram for the FM demodulator project.
The optimum design achieved 2 dB improvement in S/N ratio that amounted to 37% reduction in BER.
Robust Paper Feeder Design Case Study
Kodak’s copy machine manufacturing division was faced with improving the reliability of its paper feeder from mean time between failures of 2500 sheets to 40,000 sheets.
The Robust Design method provided drastic improvement in the method for evaluating the failure rate compared to the traditional way of feeding tens of thousands of sheets, which was very expensive and time consuming. Instead of observing the failures, the team observed the time needed for a sheet of paper to reach a sensor after the feed command is issued.
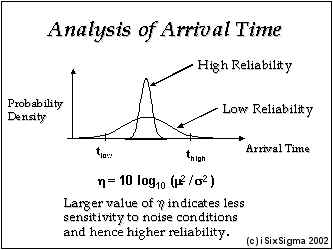
The arrival time is affected by the noise factors such as weight of the paper, smoothness, humidity, etc. If the arrival time is outside the design window, it causes feeding failure. Thus, a design that reduces the variation of the arrival time causes fewer failures.
Measurement of arrival time needed new instrumentation. But, the time for evaluating a design reduced from weeks to about one hour. Indeed, the Robust Design method uses a measurement system focused on the main function instead of measuring defects. Such measurements are invariably more productive and lead to lower total development cost.

The appropriate S/N ratio to be maximized for this project is the static, nominal the best type. The various control factors associated with this project were rapidly optimized using an orthogonal array and the S/N ratio. The project was completed in less than three months, a fraction of the time it would have taken for the traditional approach, and at a much lower cost.
The method accelerates product development such that one achieves the technological limit of a concept in a much shorter time compared to the traditional design methods. The result is high product reliability right from the beginning of product introduction and higher profits.
References
Phadke, M.S. Quality Engineering Using Robust Design, Prentice Hall, Englewood Cliff, NJ. November 1989.
Taguchi, Genichi, System of Experimental Design, Edited by Don Clausing. New York: UNIPUB/Krass International Publications, Volume 1 & 2, 1987.
Clausing, D. P., Cohen, L., Phadke, M. S., “Commercial Systems Engineering Tutorial.”
Gaydos, W., “Dynamic Parameter Design for an FM Data Demodulator” ITT Industries Annual Taguchi Symposium, Oct 1994.
Expert software developed by Phadke Associates was used for analyzing the data.