Take a look at the headlines of any newspaper today and it is easy to see that the next two years are going to be a difficult time for most companies. Among these, some organizations that have already deployed Lean or Six Sigma may be forced to reduce their labor force. Of course, there may be a lucky few that will prosper.
A major contributing factor in determining whether organizations thrive or fail is the seriousness with which their management approaches the allocation of resources for improvement projects. Although organizations usually consider the projected savings, timeliness of payback and probability of success when selecting projects to receive resources, they also may benefit from examining and making comparisons to high-performing projects completed in the past.
Recognizing the Current Strategy
The first step in making resource changes is for key decision makers to consider the following question: “What is our current strategy for allocating resources across our portfolio of identified improvement projects?” In this case, resources are parameters such as labor hours, subject matter experts, capital, and critical hardware or software available for projects.
Typically, planning meetings that are focused on resource allocation use a matrix that incorporates a composite index of the projected savings, timeliness of payback and probability of success for potential projects, with weights placed on each component according to its importance. Using a matrix like this allows several factors to be captured in resource allocation decision making. But there is still something missing from this composite approach: a look at the past.
Adding Past Projects
When considering future resource allocations, leaders commonly overlook the performance of completed projects. One reason for this is because the analysis of that performance can be difficult to conduct. Most projects have multiple input and output variables, and these variables are often difficult to compare because they are on different scales (Table 1). The result is a classic “apples vs. oranges” dilemma. Fortunately, this type of problem can be addressed with data envelopment analysis – a nonparametric method used in operations research and economics to estimate production frontiers. It is used to empirically measure productive efficiency of decision making units.
| Table 1: Information on Completed Projects | |||||
|
Inputs |
Outputs |
||||
| Man-hours | Team Size | Investment | Value Created Per Year |
Additional Opportunities Created | |
| Project 1 | 6,400 | 5 | $500 | $200,000 | $800,000 |
| Project 2 | 1,290 | 4 | $1,200 | $330,000 | $75,000 |
| Project 3 | 3,820 | 7 | $0 | $800,000 | $300,000 |
| Project 4 | 9,145 | 4 | $50,000 | $1,200,000 | $0 |
| Project 5 | 5,480 | 11 | $3,000 | $700,000 | $0 |
| Project 6 | 4,000 | 6 | $100 | $50,000 | $500,000 |
Understanding Data Envelopment Analysis
At the heart of data envelopment analysis is a familiar concept that is utilized heavily in introductory economics classes: the lessons of Robinson Crusoe. The eponymous character in Daniel Defoe’s 18th century novel is a castaway who struggles to survive on a tropical island, making use of available resources. Although this example only provides a single input (time), it does provide multiple outputs (hunting and gathering), and therefore, it is not difficult to extend the lessons learned to more complex and realistic business applications.
The example takes place on an island with only two inhabitants, Crusoe and Man Friday. Both are capable of fishing and gathering, but their skill level is not equal. The task of assigning one person as “better” than another requires placing weights on the skills both subjects possess. In many cases, including business cases, weights cannot be assigned to symbiotic variables that are both deemed necessary, such as oxygen versus food. One variable is not more important than the other because the lack of either variable means extinction. But to say that the variables are equally important is difficult because the acquisition costs of food are high compared to oxygen, which is absolutely free. In other words, the per unit acquisition costs are not equal. The business world is full of examples just like this, and the assignment of static weights is not logical in many business decisions. This is where directors of operations who have deployed continuous improvement programs can learn from Robinson Crusoe.
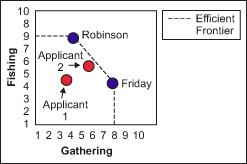
Consider the case where Crusoe and Friday receive applications from two prospects who wish to join their island community. Unfortunately, there is only room for one addition, and naturally, Crusoe and Friday want the third person to be as efficient as they are. This level of efficiency is designated by the dotted line in Figure 1. When evaluating the two applicants, it is clear that Applicant 1 is inferior to Applicant 2 because the second applicant can catch more fish and gather more food than the first applicant in the same amount of time – one day. Applicant 2 is almost as efficient as Crusoe and Friday but falls just short of the efficient frontier, which marks the optimal returns from the castaways’ hunting and gathering efforts.

Applying Island Lessons
Decision makers who hold the purse strings of funding should view their completed projects as applicants on Robinson Crusoe’s island. They can evaluate the performance of completed projects with respect to the most efficient projects in the environment. Economists define efficiency as the ratio total outputs/total inputs. This allows managers to avoid the bias in favoring projects that produce great results, when they may have used up a disproportionate amount of resources. Managers only can begin to see true performance when they view the aggregate outputs relative to the aggregate inputs.
For any organization, only a select few completed projects will form their efficient frontier. This is the line in the sand by which all other projects should be measured against. One way to determine the efficient frontier is to first categorize projects by the similarity of their inputs. A great tool for accomplishing this is principal component analysis. Cluster analysis methods such as the k-means algorithm, are also effective for categorizing projects into meta-types.
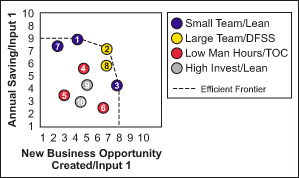
Once past projects are categorized, practitioners can calculate their efficiencies using data envelopment analysis. The next step is to evaluate the performance of categorized projects and inspect for patterns. Inevitably one or two categories will emerge as the most efficient and, therefore, they will define the efficient frontier. The last step is to rank the categories from best to worst performance. In Figure 2, it is clear that the projects categorized as High Investment/Lean and Low Man-hours/Theory of Constraints (TOC) proved to be the least efficient. In the future, these projects should be funded at a lower level than the Small Team/Lean and Large Team/DFSS projects because there is empirical evidence that these archetypes have proven to be the most efficient. In other words, they are giving the most output for the least input (resources).

Aligning to Analysis
A smart resource allocation strategy should be aligned with the results of efficiency analysis of past projects. This analysis should then be combined with predictions for future-based elements such as probability of success and projected return on investment. Data envelopment analysis has the potential to shine a new light on overlooked data.