In an era of high competition, with many companies facing a less-than-certain future, the need to increase performance in the eyes of the customer has never been stronger. Transactional processes play a major role in any company’s interaction with the customer, which makes them excellent candidates for Lean Six Sigma improvements. Methods and tools that have previously been very successful over many decades in the manufacturing sector can also be very effective in transactional environments.
Transactional vs. Manufacturing
Before practitioners begin deploying Lean Six Sigma in a transactional environment, they should become familiar with the inherent similarities and differences between the two process types. Compared with manufacturing, transactional processes tend to have:
- Decision-based business processes rather than fixed processes.
- Work activities that are more interdependent than linear.
- A strong need for fast adaptability as customers increasingly demand change.
- Many more workflows and cross-functional interactions.
- Process capabilities that are evaluated by the strength and frequency of customer complaints rather than objective metrics collected during processing.
- Processes that take place across multiple geographical locations due to historical acquisitions and prudent risk management practices.
- Inventory that is less visible, mostly in the form of electronic data and correspondence rather than physical items.
As a result of these differences:
- Staff executing transactional processes need to be more empowered so decision-making can happen fast.
- The majority of the defects are at the workflow level rather than the individual task level.
- Defects are relatively invisible and not evident until experienced by the customer.
Since, historically, the transactional business sector has had less experience with adopting data-driven Lean Six Sigma activities, formalization of improvement programs can generate more resistance across many levels of the organization than they would in a manufacturing operation. In order to demonstrate the value of business process improvement quickly, some unique characteristics need to be understood.
Characteristics of Transactional Processes
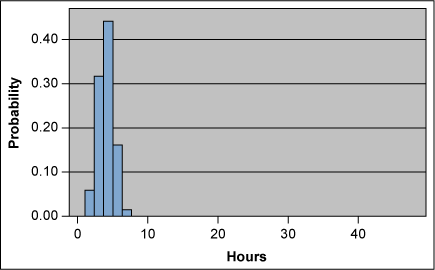
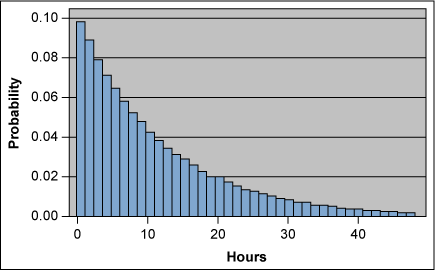
Many transactional processes contain the combination of an execution step followed by an approval step. For illustrative purposes, the execution time (Figure 1) has a mean of four hours (with a standard deviation of one hour) followed by an approval step (Figure 2) with a mean of 12 hours. Typically, the cycle times for execution steps follow a normal distribution, while those with a waiting or queuing process follow an exponential distribution.


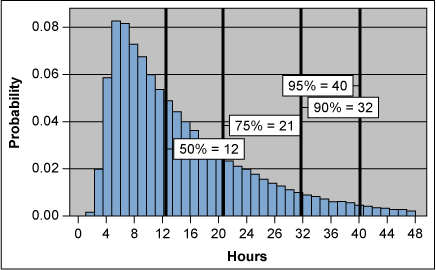
A simple simulation in Figure 3 shows that total cycle time (combining both the execution and the approval steps) at the the 50 percent point is 12 hours. However the cycle time is 32 hours at the 90 percent point and 40 hours at the 95 percent point.

As shown in Figure 3, the presence of this extended tail of the distribution will clearly add to the dissatisfaction level of the customers. From this data, it is evident that, to improve overall delivery performance, emphasis should be placed on reducing the duration of the approval step rather than the usually observed organizational behavior of reducing the execution time.
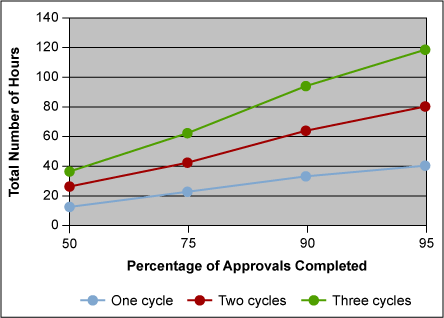
Often this sequence of execution and approval steps appears multiple times in a business process. Figure 4 and the table below show the results for one, two and three successive cycles of the example process that has a mean of four hours (one-hour standard deviation) for the execution step and a mean of 12 hours for the approval step.

| Summary of Execution/Approval Cycles | |||
|---|---|---|---|
| 50% | 90% | 95% | |
| One cycle | 12 | 32 | 40 |
| Two cycles | 25 | 63 | 80 |
| Three cycles | 37 | 95 | 120 |
For each additional cycle, the 50 percent point moves out by 12 hours, but the 90 and 95 percent points move out by roughly 32 and 40 hours respectively. This data illustrates two points:
- This additional wait time that previously may have been attributed to lackadaisical management practices is simply an outcome of the interaction between these two different types of distribution. The performance of these approval processes, or even the need for these approval processes, should be reviewed and addressed.
- Because customers are much more sensitive to delays rather than early completion, it is more important to improve the performance of the tail of the distribution, at the 90, 95 and 99 percent points. This metric is much more meaningful than using overall process averages that are used to define performance in service-level agreements.
Tool Flow in a Transactional Environment
Transactional processes do not have the same physical characteristics as operational processes, but the volume and complexity of transactions that have to be executed by financial, healthcare and other data processing departments still require the rigor of Lean Six Sigma.
To address underperformance, a basic framework of five tools should be introduced: a project charter, a SIPOC chart (Suppliers, Inputs, Process, Outputs, Customers), a value stream map, a cause-and-effect diagram and selection matrix, and a process-failure mode and effects (P-FMEA) analysis. The action items selected from the P-FMEA can then be executed using the project management methods and resources present in the organization, and control plans can be introduced. Here are some basic descriptions of the five tools and their utility in the transactional arena:
Project charter – This document provides a detailed description of the business needs that will be addressed in the project. The charter serves as the link to the business problem, the financial impact and the identification of the process owner, and adds clarity and a sense of common purpose to the project.
SIPOC diagram – This tool is a high-level process map that identifies all relevant elements of a process improvement project before work begins. Often there is no common view of all the process inputs and outputs required. Inputs are gathered serially rather than in parallel, and outputs are provided on request rather than as a structured part of the process output. The SIPOC provides a common high-level view of the process to be improved – something that can become lost in a geographically disperse organization.
Value stream map – Typically used in Lean projects, this pencil-and-paper tool helps practitioners see and understand the flow of material and information as a product or services makes its way through the value stream. By collectively visualizing the entire workflow and introducing the concept of rolled yield and rework, these maps provide insight into the areas that need to be addressed.
Transactional processes are prone to develop numerous rework loops, and unless quantified and controlled, the actual performance level can degrade dramatically. This is not visible to the wider organization that uses a simple linear model. Some of the greatest opportunities for driving process excellence can be found by using value stream mapping to analyze the gaps between functional groups.
Cause-and-effect diagram and selection matrix – Also called an Ishikawa, or fishbone, diagram, the cause-and-effect diagram is a visual tool used to organize possible causes for a specific problem into logical groups and to help identify root causes. This is an opportunity for all involved to provide ideas about issues that affect the whole process. Many effects that arise are caused by prior actions of individuals who have not visualized the downstream consequences. Often, feedback systems do not exist all, so the same issues continually recur. The formality of the process brings individuals together who would not otherwise meet in a problem-solving environment.
The value of establishing a common understanding of the problem, of possible solutions and of possible implementations is extremely important in these environments. Transactional processes tend to involve multiple geographical locations involving people who only ever meet by phone or email to execute actions. Coming together to look at the entire process simply does not take place without the rigor of these types of initiatives. By using these cause-and-effect diagrams and selection matrices, the team can move into the execution stage with the confidence that they are focusing in the right areas.
P-FMEA – This tool, which helps identify and prevent potential problems before they occur, provides a structured approach to the myriad ideas that exist within the organization. This is especially powerful in a geograhically distributed organization, where coming together to develop common assessment criteria is not normal practice. Once these ideas are selected and resources allocated, the implementation phase can begin.
Gaining Better Insight
The advantage of this simple sequence of tools is that the training can be carried out by just-in-time learning and facilitated by cross-functional teams led by Black Belts. Results can be obtained quickly, providing insight into cycle-time reduction and process improvement across various transactional environments. Once these insights are understood and the results demonstrated, the opportunities to better serve the customer and develop top-line growth can be made visible and the benefits realized by the broader application of these techniques.